(a) For the Home Depot data, give the notation for the mean for smartphone users.

Elementary Geometry for College Students
6th Edition
ISBN:9781285195698
Author:Daniel C. Alexander, Geralyn M. Koeberlein
Publisher:Daniel C. Alexander, Geralyn M. Koeberlein
ChapterA: Appendices
SectionA.1: Algebraic Expressions
Problem 2E

Related questions
Question
part d: find the difference in means
Transcribed Image Text:Assessment Builder UI AppX
A NWP Assessment Player Ul Appl x
b Login I bartleby
https://education.wiley.com/was/ui/v2/assessment-player/index.html?launchld%33e2e98a5-2064-4acd-9b75-ab82c7e8feb0#/question/22
0work email
-© Lifespan Connect
b cheating
New folder
-3 WileyPLUS: Module Two Homework
Question 23 of 23
-/1.6 E
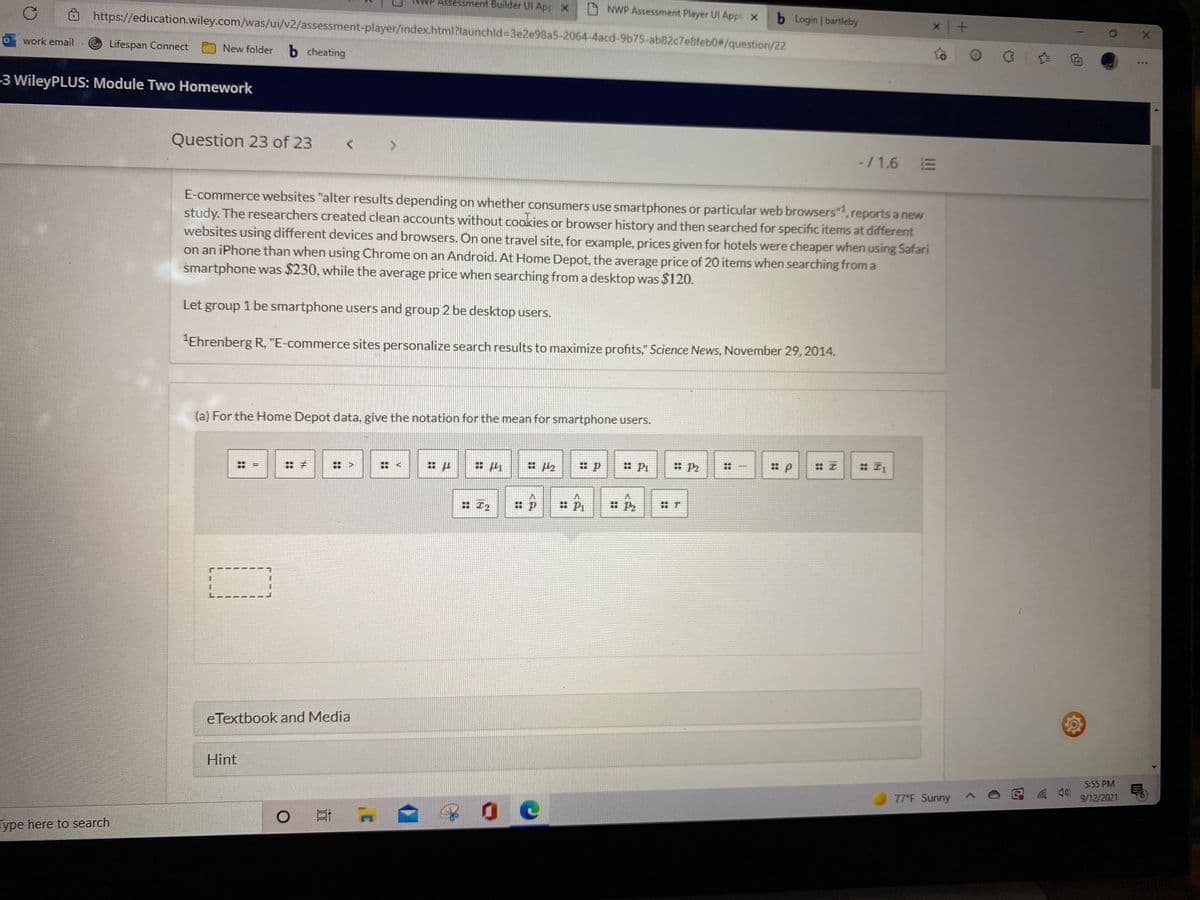
E-commerce websites "alter results depending on whether consumers use smartphones or particular web browsers",reports a new
study. The researchers created clean accounts without cookies or browser history and then searched for specific items at different
websites using different devices and browsers. On one travel site, for example, prices given for hotels were cheaper when using Safari
on an iPhone than when using Chrome on an Android. At Home Depot, the average price of 20 items when searching from a
smartphone was $230, while the average price when searching from a desktop was $120.
Let group 1 be smartphone users and group 2 be desktop users.
"Ehrenberg R, "E-commerce sites personalize search results to maximize profits," Science News, November 29, 2014.
(a) For the Home Depot data, give the notation for the mean for smartphone users.
: P2
: Pi
: P2
:エ
: エ2
: P2
eTextbook and Media
Hint
5:55 PM
9/12/2021
77°F Sunny
Type here to search
::
Transcribed Image Text:Question 23 of 23
-/ 1.6 E
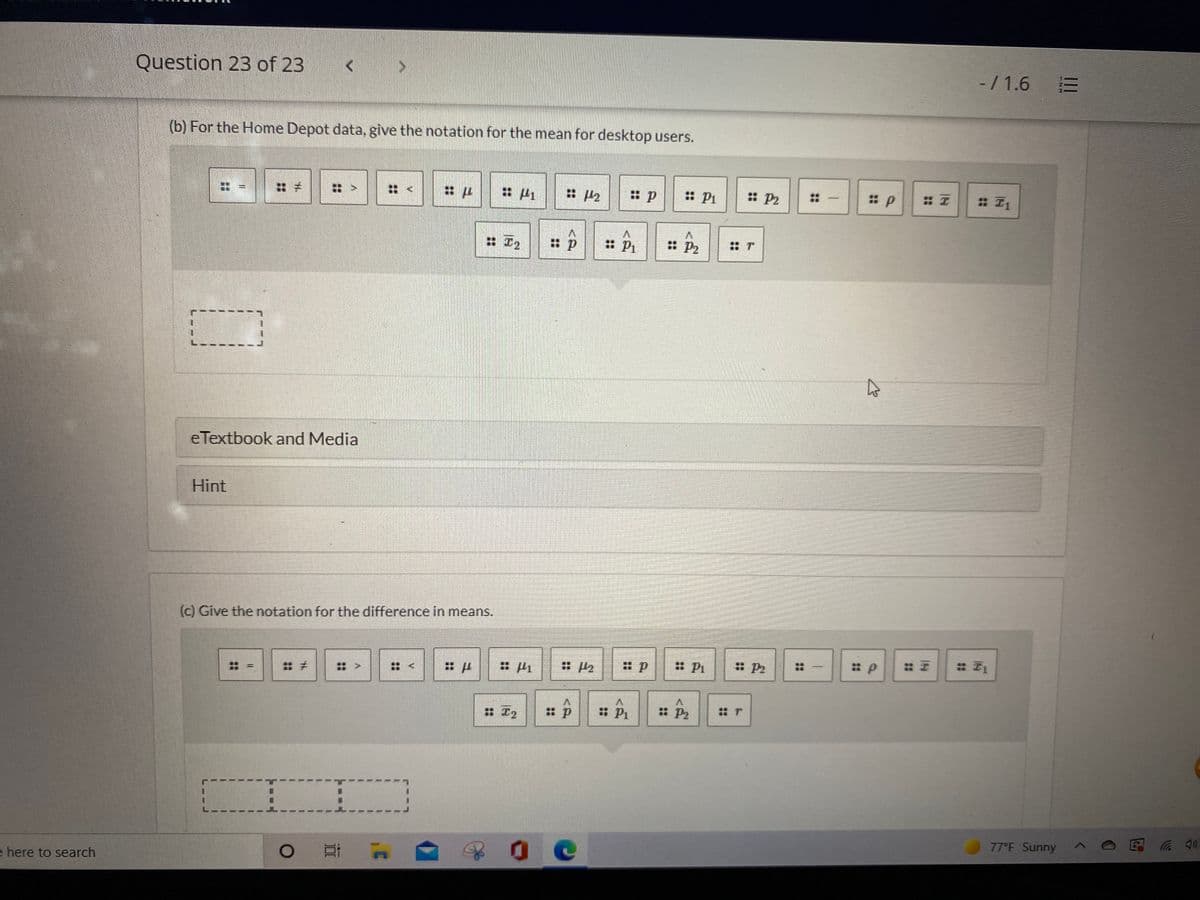
(b) For the Home Depot data, give the notation for the mean for desktop users.
: P1
: P2
::
|
: I2
: P2
eTextbook and Media
Hint
(c) Give the notation for the difference in means.
:: 四
: Pi
: P2
::
: >
V.
: エ2
: P2
77°F Sunny
0 日 A
e here to search
1.
Expert Solution
This question has been solved!
Explore an expertly crafted, step-by-step solution for a thorough understanding of key concepts.

This is a popular solution!

Trending now
This is a popular solution!

Step by step
Solved in 2 steps

Recommended textbooks for you
Elementary Geometry for College Students
Geometry
ISBN:
9781285195698
Author:
Daniel C. Alexander, Geralyn M. Koeberlein
Publisher:
Cengage Learning
Elementary Geometry for College Students
Geometry
ISBN:
9781285195698
Author:
Daniel C. Alexander, Geralyn M. Koeberlein
Publisher:
Cengage Learning