A group of researchers developed a 95% z confidence interval for the mean body mass index (BMI) of women aged 20 to 29 years, based on a national random sample of 657 such women. They assumed that the population standard deviation was known to be o = 7.5. In fact, the sample data had mean BMI x = 26.9 and standard deviation s = 7.67. What is the 95% t confidence interval for the mean BMI of all young women? (Round your answers to three decimal places.) to t distribution critical values Confidence level C Degrees of freedom 50% 60% 70% 80% 90% 95% 96% 98% 99% 99.5% 99.8% 99.9% 318.3 1.376 1.061 0.978 0.941 0.727 0.920 636.6 31.60 12.92 1.963 1.386 12.71 4.303 15.89 1.000 0.816 31.82 6.965 3.078 6.314 2.920 63.66 127.3 1.886 14.09 7.453 4.849 3.482 2.999 2.757 9.925 22.33 4.541 3.747 3.365 3.143 2.998 5.841 4.604 4.032 3.707 3.499 3.355 0.765 1.250 1.638 2.353 10.21 3.182 2.776 2.571 1.190 1.156 1.134 1.119 7.173 5.893 5.208 4.785 4.501 4.297 4.144 0.741 1.533 1.476 1.440 1.415 1.397 1.383 1.372 1.363 1.356 2.132 2.015 1.943 1.895 5.598 8.610 6.869 5.959 5.408 5.041 4.781 4.587 4.437 4.318 4.221 4.140 4.073 4.015 3.965 3.922 4 4.773 0.718 0.906 0.711 0.896 2.447 2.365 2.612 2.517 4.317 4.029 3.833 3.690 3.581 3.497 3.428 3.372 3.326 1.860 1.833 1.812 2.449 2.398 2.359 2.328 0.706 0.889 1.106 2.306 2.896 0.703 0.883 0.700 0.879 1.100 1.093 2.262 2.228 2.201 3.250 3.169 2.821 2.764 2.718 2.681 10 11 12 0.697 0.876 0.873 0.870 1.088 1.083 1.796 1.782 3.106 3.055 4.025 3.930 0.695 2.179 2.303 0.694 0.692 0.691 1.350 1.345 1.341 1.337 1.333 1.079 1.771 1.761 1.753 2.282 2.264 2.249 2.235 2.224 2.214 13 2.160 2.650 3.012 3.852 3.787 3.733 2.977 2.947 2.921 2.898 2.878 14 15 0.868 1.076 0.866 1.074 0.865 2.145 2.131 2.624 2.602 3.286 3.252 3.222 3.197 2.120 2.110 1.746 1.740 1.734 1.729 1.725 16 17 0.690 0.689 1.071 0.863 1.069 2.583 2.567 3.686 3.646 3.611 18 0.688 0.862 1.067 1.330 2.101 2.552 0.688 0.687 0.861 0.860 1.064 0.859 1.328 1.325 1.323 2.539 2.528 2.518 1.066 19 20 2.093 2.086 2.205 2.197 2.861 2.845 2.831 3.174 3.153 3.579 3.552 3.527 3.883 3.850 3.819 2.080 2.074 2.069 2.064 2.060 21 0.686 1.063 1.721 2.189 3.135 1.061 1.060 1.059 1.058 1.058 1321 1.319 2.183 2.177 2.172 2.167 0.686 0.685 0.685 0.684 0.684 0.684 0.683 0.683 0.683 22 23 0.858 0.858 1.717 1.714 2.508 2.500 2.819 2.807 2.797 2.787 2.779 3.119 3.505 3.792 3.768 3.745 3.725 3.104 3.485 3.467 3.450 3.435 3.421 3.408 3.396 24 25 0.857 0.856 0.856 1318 1316 1.711 1.706 2.492 2.485 2.479 2.473 2.467 2.462 2.457 2.423 2.403 2.390 2.374 2.364 2.330 3.091 3.078 1.706 1.703 1.701 1.699 1.697 26 1.315 2.056 2.162 3.067 3.707 2.052 2.048 2.045 2.042 2.021 27 28 1.314 1.313 2.771 2.763 3.690 3.674 0.855 0.855 0.854 0.854 0.851 0.849 0.848 0.846 0.845 0.675 0.842 0.674 0.841 1.057 1.056 1.055 1.055 1.050 2.158 2.154 2.150 2.147 3.057 3.047 29 30 1.311 1.310 2.756 3.038 3.659 3.030 2.971 2.750 3.385 40 50 60 3.646 3.551 3.496 3.460 0.681 1.303 1.684 2.123 2.704 2.678 2.660 3.307 0.679 0.679 1.047 1.045 1.043 1.292 1.042 1.037 1.036 1.299 1.296 1.676 1.671 2.009 2.000 2.109 2.099 2.937 2.915 3.261 3.232 3.195 0.678 0.677 1.664 1.660 2.088 2.081 2.056 2.054 2.887 2.871 2.813 80 100 1.290 1.282 1.990 1.984 1.962 2.639 2.626 2.581 3.174 3.098 3.416 3.390 1.646 1.645 1000 3.300 1.282 1.960 2.326 2.576 2.807 3.091 3.291 One-sided P .25 .20 .15 .10 .05 .025 .02 .01 .005 .0025 .001 .0005 Two-sided P .50 40 30 .20 .10 .05 .04 .02 .01 .005 .002 .001
A group of researchers developed a 95% z confidence interval for the mean body mass index (BMI) of women aged 20 to 29 years, based on a national random sample of 657 such women. They assumed that the population standard deviation was known to be o = 7.5. In fact, the sample data had mean BMI x = 26.9 and standard deviation s = 7.67. What is the 95% t confidence interval for the mean BMI of all young women? (Round your answers to three decimal places.) to t distribution critical values Confidence level C Degrees of freedom 50% 60% 70% 80% 90% 95% 96% 98% 99% 99.5% 99.8% 99.9% 318.3 1.376 1.061 0.978 0.941 0.727 0.920 636.6 31.60 12.92 1.963 1.386 12.71 4.303 15.89 1.000 0.816 31.82 6.965 3.078 6.314 2.920 63.66 127.3 1.886 14.09 7.453 4.849 3.482 2.999 2.757 9.925 22.33 4.541 3.747 3.365 3.143 2.998 5.841 4.604 4.032 3.707 3.499 3.355 0.765 1.250 1.638 2.353 10.21 3.182 2.776 2.571 1.190 1.156 1.134 1.119 7.173 5.893 5.208 4.785 4.501 4.297 4.144 0.741 1.533 1.476 1.440 1.415 1.397 1.383 1.372 1.363 1.356 2.132 2.015 1.943 1.895 5.598 8.610 6.869 5.959 5.408 5.041 4.781 4.587 4.437 4.318 4.221 4.140 4.073 4.015 3.965 3.922 4 4.773 0.718 0.906 0.711 0.896 2.447 2.365 2.612 2.517 4.317 4.029 3.833 3.690 3.581 3.497 3.428 3.372 3.326 1.860 1.833 1.812 2.449 2.398 2.359 2.328 0.706 0.889 1.106 2.306 2.896 0.703 0.883 0.700 0.879 1.100 1.093 2.262 2.228 2.201 3.250 3.169 2.821 2.764 2.718 2.681 10 11 12 0.697 0.876 0.873 0.870 1.088 1.083 1.796 1.782 3.106 3.055 4.025 3.930 0.695 2.179 2.303 0.694 0.692 0.691 1.350 1.345 1.341 1.337 1.333 1.079 1.771 1.761 1.753 2.282 2.264 2.249 2.235 2.224 2.214 13 2.160 2.650 3.012 3.852 3.787 3.733 2.977 2.947 2.921 2.898 2.878 14 15 0.868 1.076 0.866 1.074 0.865 2.145 2.131 2.624 2.602 3.286 3.252 3.222 3.197 2.120 2.110 1.746 1.740 1.734 1.729 1.725 16 17 0.690 0.689 1.071 0.863 1.069 2.583 2.567 3.686 3.646 3.611 18 0.688 0.862 1.067 1.330 2.101 2.552 0.688 0.687 0.861 0.860 1.064 0.859 1.328 1.325 1.323 2.539 2.528 2.518 1.066 19 20 2.093 2.086 2.205 2.197 2.861 2.845 2.831 3.174 3.153 3.579 3.552 3.527 3.883 3.850 3.819 2.080 2.074 2.069 2.064 2.060 21 0.686 1.063 1.721 2.189 3.135 1.061 1.060 1.059 1.058 1.058 1321 1.319 2.183 2.177 2.172 2.167 0.686 0.685 0.685 0.684 0.684 0.684 0.683 0.683 0.683 22 23 0.858 0.858 1.717 1.714 2.508 2.500 2.819 2.807 2.797 2.787 2.779 3.119 3.505 3.792 3.768 3.745 3.725 3.104 3.485 3.467 3.450 3.435 3.421 3.408 3.396 24 25 0.857 0.856 0.856 1318 1316 1.711 1.706 2.492 2.485 2.479 2.473 2.467 2.462 2.457 2.423 2.403 2.390 2.374 2.364 2.330 3.091 3.078 1.706 1.703 1.701 1.699 1.697 26 1.315 2.056 2.162 3.067 3.707 2.052 2.048 2.045 2.042 2.021 27 28 1.314 1.313 2.771 2.763 3.690 3.674 0.855 0.855 0.854 0.854 0.851 0.849 0.848 0.846 0.845 0.675 0.842 0.674 0.841 1.057 1.056 1.055 1.055 1.050 2.158 2.154 2.150 2.147 3.057 3.047 29 30 1.311 1.310 2.756 3.038 3.659 3.030 2.971 2.750 3.385 40 50 60 3.646 3.551 3.496 3.460 0.681 1.303 1.684 2.123 2.704 2.678 2.660 3.307 0.679 0.679 1.047 1.045 1.043 1.292 1.042 1.037 1.036 1.299 1.296 1.676 1.671 2.009 2.000 2.109 2.099 2.937 2.915 3.261 3.232 3.195 0.678 0.677 1.664 1.660 2.088 2.081 2.056 2.054 2.887 2.871 2.813 80 100 1.290 1.282 1.990 1.984 1.962 2.639 2.626 2.581 3.174 3.098 3.416 3.390 1.646 1.645 1000 3.300 1.282 1.960 2.326 2.576 2.807 3.091 3.291 One-sided P .25 .20 .15 .10 .05 .025 .02 .01 .005 .0025 .001 .0005 Two-sided P .50 40 30 .20 .10 .05 .04 .02 .01 .005 .002 .001

MATLAB: An Introduction with Applications
6th Edition
ISBN:9781119256830
Author:Amos Gilat
Publisher:Amos Gilat
Chapter1: Starting With Matlab
Section: Chapter Questions
Problem 1P

Related questions
Question

Transcribed Image Text:A group of researchers developed a 95% z confidence interval for the mean body mass index (BMI) of women aged 20 to 29 years, based on a national random sample of
657 such women. They assumed that the population standard deviation was known to be o = 7.5. In fact, the sample data had mean BMI x = 26.9 and standard deviation
s = 7.67. What is the 95% t confidence interval for the mean BMI of all young women? (Round your answers to three decimal places.)
to
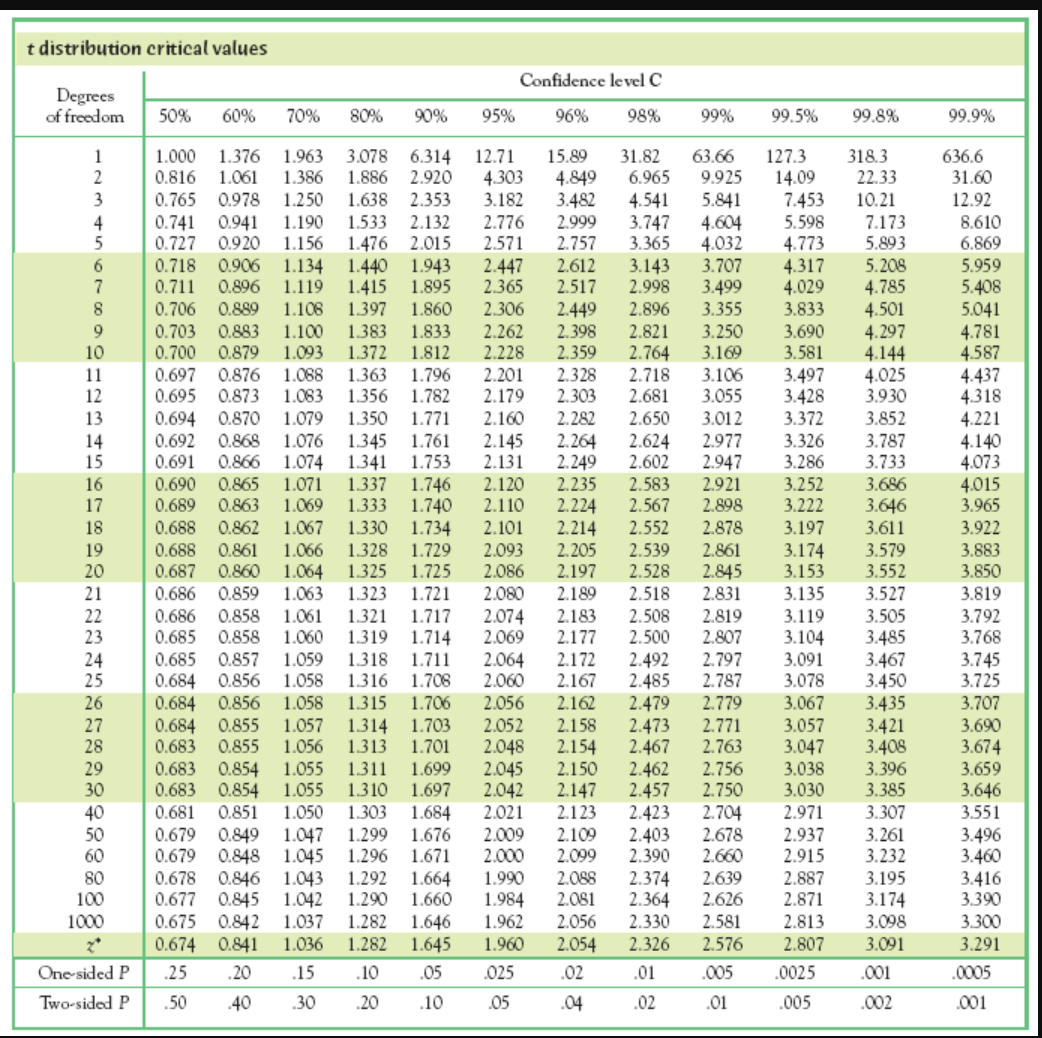
Transcribed Image Text:t distribution critical values
Confidence level C
Degrees
of freedom
50%
60%
70%
80%
90%
95%
96%
98%
99%
99.5%
99.8%
99.9%
318.3
1.376
1.061
0.978
0.941
0.727 0.920
636.6
31.60
12.92
1.963
1.386
12.71
4.303
15.89
1.000
0.816
31.82
6.965
3.078
6.314
2.920
63.66
127.3
1.886
14.09
7.453
4.849
3.482
2.999
2.757
9.925
22.33
4.541
3.747
3.365
3.143
2.998
5.841
4.604
4.032
3.707
3.499
3.355
0.765
1.250
1.638
2.353
10.21
3.182
2.776
2.571
1.190
1.156
1.134
1.119
7.173
5.893
5.208
4.785
4.501
4.297
4.144
0.741
1.533
1.476
1.440
1.415
1.397
1.383
1.372
1.363
1.356
2.132
2.015
1.943
1.895
5.598
8.610
6.869
5.959
5.408
5.041
4.781
4.587
4.437
4.318
4.221
4.140
4.073
4.015
3.965
3.922
4
4.773
0.718 0.906
0.711 0.896
2.447
2.365
2.612
2.517
4.317
4.029
3.833
3.690
3.581
3.497
3.428
3.372
3.326
1.860
1.833
1.812
2.449
2.398
2.359
2.328
0.706 0.889
1.106
2.306
2.896
0.703 0.883
0.700 0.879
1.100
1.093
2.262
2.228
2.201
3.250
3.169
2.821
2.764
2.718
2.681
10
11
12
0.697 0.876
0.873
0.870
1.088
1.083
1.796
1.782
3.106
3.055
4.025
3.930
0.695
2.179
2.303
0.694
0.692
0.691
1.350
1.345
1.341
1.337
1.333
1.079
1.771
1.761
1.753
2.282
2.264
2.249
2.235
2.224
2.214
13
2.160
2.650
3.012
3.852
3.787
3.733
2.977
2.947
2.921
2.898
2.878
14
15
0.868
1.076
0.866 1.074
0.865
2.145
2.131
2.624
2.602
3.286
3.252
3.222
3.197
2.120
2.110
1.746
1.740
1.734
1.729
1.725
16
17
0.690
0.689
1.071
0.863 1.069
2.583
2.567
3.686
3.646
3.611
18
0.688
0.862 1.067
1.330
2.101
2.552
0.688
0.687
0.861
0.860 1.064
0.859
1.328
1.325
1.323
2.539
2.528
2.518
1.066
19
20
2.093
2.086
2.205
2.197
2.861
2.845
2.831
3.174
3.153
3.579
3.552
3.527
3.883
3.850
3.819
2.080
2.074
2.069
2.064
2.060
21
0.686
1.063
1.721
2.189
3.135
1.061
1.060
1.059
1.058
1.058
1321
1.319
2.183
2.177
2.172
2.167
0.686
0.685
0.685
0.684
0.684
0.684
0.683
0.683
0.683
22
23
0.858
0.858
1.717
1.714
2.508
2.500
2.819
2.807
2.797
2.787
2.779
3.119
3.505
3.792
3.768
3.745
3.725
3.104
3.485
3.467
3.450
3.435
3.421
3.408
3.396
24
25
0.857
0.856
0.856
1318
1316
1.711
1.706
2.492
2.485
2.479
2.473
2.467
2.462
2.457
2.423
2.403
2.390
2.374
2.364
2.330
3.091
3.078
1.706
1.703
1.701
1.699
1.697
26
1.315
2.056
2.162
3.067
3.707
2.052
2.048
2.045
2.042
2.021
27
28
1.314
1.313
2.771
2.763
3.690
3.674
0.855
0.855
0.854
0.854
0.851
0.849
0.848
0.846
0.845
0.675 0.842
0.674 0.841
1.057
1.056
1.055
1.055
1.050
2.158
2.154
2.150
2.147
3.057
3.047
29
30
1.311
1.310
2.756
3.038
3.659
3.030
2.971
2.750
3.385
40
50
60
3.646
3.551
3.496
3.460
0.681
1.303
1.684
2.123
2.704
2.678
2.660
3.307
0.679
0.679
1.047
1.045
1.043 1.292
1.042
1.037
1.036
1.299
1.296
1.676
1.671
2.009
2.000
2.109
2.099
2.937
2.915
3.261
3.232
3.195
0.678
0.677
1.664
1.660
2.088
2.081
2.056
2.054
2.887
2.871
2.813
80
100
1.290
1.282
1.990
1.984
1.962
2.639
2.626
2.581
3.174
3.098
3.416
3.390
1.646
1.645
1000
3.300
1.282
1.960
2.326
2.576
2.807
3.091
3.291
One-sided P
.25
.20
.15
.10
.05
.025
.02
.01
.005
.0025
.001
.0005
Two-sided P
.50
40
30
.20
.10
.05
.04
.02
.01
.005
.002
.001
Expert Solution
This question has been solved!
Explore an expertly crafted, step-by-step solution for a thorough understanding of key concepts.

This is a popular solution!

Trending now
This is a popular solution!

Step by step
Solved in 2 steps with 3 images

Recommended textbooks for you
MATLAB: An Introduction with Applications
Statistics
ISBN:
9781119256830
Author:
Amos Gilat
Publisher:
John Wiley & Sons Inc

Probability and Statistics for Engineering and th…
Statistics
ISBN:
9781305251809
Author:
Jay L. Devore
Publisher:
Cengage Learning

Statistics for The Behavioral Sciences (MindTap C…
Statistics
ISBN:
9781305504912
Author:
Frederick J Gravetter, Larry B. Wallnau
Publisher:
Cengage Learning
MATLAB: An Introduction with Applications
Statistics
ISBN:
9781119256830
Author:
Amos Gilat
Publisher:
John Wiley & Sons Inc
Probability and Statistics for Engineering and th…
Statistics
ISBN:
9781305251809
Author:
Jay L. Devore
Publisher:
Cengage Learning
Statistics for The Behavioral Sciences (MindTap C…
Statistics
ISBN:
9781305504912
Author:
Frederick J Gravetter, Larry B. Wallnau
Publisher:
Cengage Learning

Elementary Statistics: Picturing the World (7th E…
Statistics
ISBN:
9780134683416
Author:
Ron Larson, Betsy Farber
Publisher:
PEARSON

The Basic Practice of Statistics
Statistics
ISBN:
9781319042578
Author:
David S. Moore, William I. Notz, Michael A. Fligner
Publisher:
W. H. Freeman

Introduction to the Practice of Statistics
Statistics
ISBN:
9781319013387
Author:
David S. Moore, George P. McCabe, Bruce A. Craig
Publisher:
W. H. Freeman