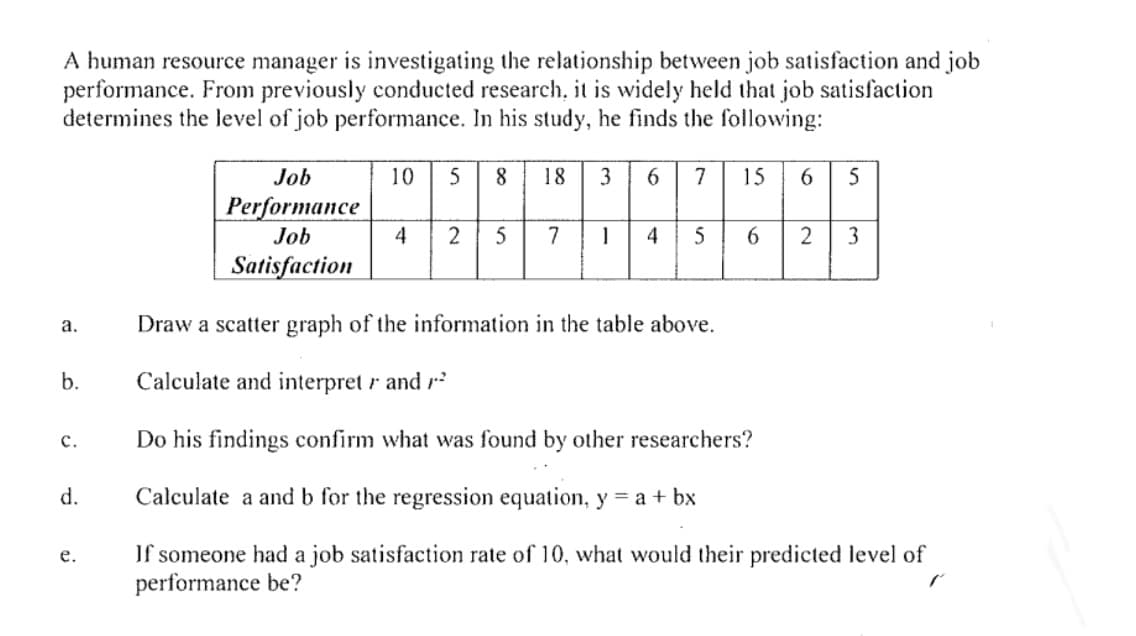
A human resource manager is investigating the relationship between job satisfaction and job performance. From previously conducted research, it is widely held that job satisfaction determines the level of job performance. In his study, he finds the following:
Q: I oll two dice and observe two numbers X and Y. 1. Find Rx, Ry and the PMFS of X and Y. 2. Find P(X…
A:
Q: An Internet Service Provider opens 10 new accounts per day, on average. Let X be a random variable…
A:
Q: 8 Find the 75th percentile. 9. What is the percentile for 61? 10 Find the 60th percentile.
A: 8) The 75th percentile is
Q: Question 27 The owner of a small business is considering three options: buying a computer, leasing a…
A:
Q: 1d) Give one example of a ordinal variable and explain why you think your example approximate the…
A: Please find the explanation below. Thank you
Q: A golf ball is selected at random from a golf bag. If the golf bag contains 6 red balls, 5 green…
A: The answer is attached below,
Q: eting brands, Rain and Shine, produced two different latex pait (MCTV). While thankful for these two…
A: For rain brand : sample size (n1) = 14 sample mean (x̄1) = Σx1 /n1 = 53.8/12 = 3.84 sample…
Q: The transmission on a model of a specific car has a warranty for 40,000 miles. It is known that the…
A: Given,mean(μ)=72,000standard deviation(σ)=12,000
Q: Do all possible ways to put meaning into the given sets of data as follows: Entrance test results of…
A:
Q: Use the Procedure for Two-Way Analysis of Variance flow chart interactive to answer the following…
A:
Q: average per page,
A:
Q: Find the Z-scores that separate the middle 22% of the distribution from the area in the tails of…
A: Let z be the standard normally distributed random variable with mean 0 and standard deviation 1
Q: A new batch of processors are to be tested for effciency. The same specific set of tasks are run by…
A: Since you have posted a question with multiple sub-parts, we will solve first three sub- parts for…
Q: Let 0 denote the probability that a randomly sampled individual in some population voted…
A:
Q: Prove that E, P(X = n) = 1. Ener
A: Given that ∑Px=n=1 n=r to ∞ .........
Q: in a random sample of 500 police officers how many have an annual salary of at least $58,750
A: Let X denote the no.of police officer salaries and it follows normal distribution with mean of…
Q: A class is composed of 20 boys and 25 girls. If a pupil is called to recite, what is the…
A: Given A class is composed of 20 boys and 25 girls. If a pupil is called to recite, what is the…
Q: Y is a random variable and "a" and "b" two real constants. Without resorting to the properties of…
A: Given that, Y is a random variable and "a" and "b" two real constants. Without resorting to the…
Q: A joint probability is the a) sum of the probabilities of two independent events O probability of…
A: We have given the following statement. Note: According to Bartleby expert guidelines, we can answer…
Q: In certain weather forecast , the chance of a thunderstorm is started as 13 % .Express the indicated…
A:
Q: Consider the following algorithm that takes inputs a parameter 0<p<1 and a natural number n.…
A: A Bernoulli distribution models the distribution of a single binary outcome while a binomial…
Q: (a) Two sets of n independent trials are performed, independently of each other, and each trial…
A:
Q: • Enumerate and differentiate the approaches in calculating probabilities. • Differentiate mutually…
A: (a) The objective is to enumerate and differentiate the approaches in calculating probabilities.
Q: Which of these would not make you question the results of a study? O A. Anonymous answers O B. A…
A:
Q: +bx2 0 <x<1 The random variable X has the probability density function f (x) = {ax otherwise If E…
A:
Q: probability
A: Tree Diagram: It represents all the possible outcomes of an event in a tree format. It starts with a…
Q: A measure of the outcome of a decision such as profit, cost, or time is known as a --- О рayoff…
A: We have given the following statement. Note: According to Bartleby expert guidelines, we can answer…
Q: A. Find the area under the standard normal curve. from z = 0 to z = 1.46 from z = -0.32 to z = 0.98…
A: As per company guidelines I solved exactly three subparts of the first question ..thank you
Q: nts) the table below shows the number of books the Jefferson Middle school students read each month…
A: Given information: Months=September, October, November, December, January, February, March, April,…
Q: What is the probability that a point chosen at random on the grid will lie in the unshaded region? 3…
A:
Q: P(female)?
A: It is given that Number of females = 20 Total = 40
Q: The IQs of 600 applicants of a certain college are approximately normally distributed with a mean of…
A:
Q: wo discrete independent random variables X and Y are such that X can take values 2,3,5 and Y can…
A: It is given that X and Y are independent then P(X = x, Y = y) = P(X = x).P(Y = y)
Q: Consider the data below. Three random samples in different cities were selected. Water use per…
A: There are 3 independent samples which are city 1, city 2 and city 3. We have to test whether samples…
Q: Three switches connected in parallel operate independently. Each switch remains closed with…
A: Given that, Three switches that are connected in parallel operate independently. Each switch remains…
Q: Consider now a different joint probability density function for X and Y, namely | 12ye-3x-2y² |0 if…
A:
Q: Bias that results when participants are allowed to select the study group they want to join. If…
A: The objective is to identify the Bias that results when participants are allowed to select the study…
Q: Beth wants to determine a 99 percent confidence interval for the true proportion p of high school…
A:
Q: s tan dard deviation(a) = 348 s tan dard deviation(o) = 112 Required probability is P x 100 -() = P…
A: It is given that the sample size, mean and standard deviation of each part. Here, need to draw the…
Q: Table 1 22 33 37 53 57 69 85 102 106 112 23 33 38 53 59 70 86 104 107 112 24 35 41 54 61 70 101 105…
A: As per our guidelines we can solve first three sub part of question and rest can be reposted.…
Q: The average score of employees on a mental examination is 120. Suppose that nothing is known about…
A: The average score of employees on a mental examination is 120.
Q: Kate is in the French club. There are 32 students in the club. The French teacher will pick two…
A: We have given that, French teacher will pick two students at random to guide visiting students…
Q: If a fair coin is tossed 7 times, what is the probability, rounded to the nearest thousandth, of…
A: Given that Number of trials n=7 Success of probability p =1/2=0.5 X~binomial (n,p) nCx = n!/(n…
Q: Sam is practising free-throws in basketball. She has a 4/5 chance of scoring each time she shoots…
A: Given Information: The chance of scoring each time Sam shoots from the free-throw line is 45. That…
Q: Let X1, X2, ..., Xn be independent and identically distributed random variables such that P(X1 = 1)…
A:
Q: 3. Let X1, X2, ..., X, be a random sample from a normal population with mean u and variance a2 taken…
A: Please see the attachment......
Q: WFC Average 0.65% 10.26% StDev. Min -28.99% Max 27.51% 25. Based on the table above, what is the…
A: The average and standard deviation of a normal distribution is 0.65% and 10.26%. The probability of…
Q: Learning Task 3 Consider the situation below and answer the questions that follow. San Jose National…
A:
Q: Use the output and an appropriate table to compute the P-value for the test of H0:μ≥73.6 versus…
A: In testing of hypothesis, the p-value represents the probability of getting results at least as…
Q: 6.31 Boos and Hughes-Oliver (1998) detail a number of instances where application of Basu's Theorem…
A: Let X1,.....,Xn be the independently identically distributed random variables follows nμ,σ2 where σ2…
Trending now
This is a popular solution!
Step by step
Solved in 2 steps with 1 images
- For a table of national information regarding a specific country, it is found that the correlation with Internet use is 0.545 for GDP, 0.734 for cellular-phone use, 0.664 for literacy, −0.893 for fertility, and 0.854 for CO2 emissions. Which variable has the weakest linear association with Internet use? a. GDP has the weakest linear association with Internet use. b. Cellular-phone use has the weakest linear association with Internet use. c. Fertility has the weakest linear association with Internet use. d. CO2 emissions has the weakest linear association with Internet use. e. Literacy has the weakest linear association with Internet use.A consumer buying cooperative tested the effective heating area of 20 different electric space heaters with different wattages. Here are the results. Wattage Area 1 750 291 2 1750 83 3 1250 215 4 1750 209 5 1500 295 6 750 153 7 1000 40 8 750 166 9 1250 115 10 1250 146 11 750 113 12 1000 56 13 1750 284 14 1000 45 15 750 82 16 1250 175 17 750 150 18 1500 231 19 1000 87 20 750 52 A. Compute the correlation between the wattage and heating area. Is there a direct or an indirect relationship? (Round your answer to 3 decimal places.) B. Conduct a test of hypothesis to determine if it is reasonable that thecoefficient is greater than zero. Use the .05 significance level. (Round youranswer to 3 decimal places.) C. Develop the regression equation for effective heating based on wattage. (Roundyour answer to 3 decimal places.)…Heater Wattage Area 1 1000 108 2 750 291 3 1500 100 4 1000 43 5 1250 68 6 1500 181 7 1250 254 8 750 228 9 1500 126 10 1500 166 11 750 45 12 750 237 13 1000 75 14 1750 126 15 1750 249 16 1750 105 17 1750 298 18 1250 212 19 750 98 20 750 185 A consumer buying cooperative tested the effective heating area of 20 different electric space heaters with different wattages. a. Compute the correlation between the wattage and heating area. Is there a direct or an indirect relationship? (Round your answer to 4 decimal places.) The correlation of Wattage and Area is ________ b. Conduct a test of hypothesis to determine if it is reasonable that the coefficient is greater than zero. Use the 0.050 significance level. (Round intermediate calculations and final answer to 3 decimal places.)H0: ρ ≤ 0; H1: ρ > 0 Reject H0 if t > 1.734…
- The following data give the percentage of women working in fivecompanies in the retail and trade industry. The percentage ofmanagement jobs held by women in each company is also shown. % Working 67 45 73 54 61 % Management 49 21 65 47 33 a. Develop a scatter diagram for these data with the percentage ofwomen working in the company as the independent variable.b. What does the scatter diagram developed in part (a) indicateabout the relationship between the two variables?c. Try to approximate the relationship between the percentage ofwomen working in the company and the percentage of management jobs held by women in that company.d. Develop the estimated regression equation by computing thevalues of bo and b1.e. Predict the percentage of management jobs held by women in acompany that has 60% women employees.Find Coefficient Correlation between population and total. state abb region population total 1 Alabama AL South 4779736 135 2 Alaska AK West 710231 19 3 Arizona AZ West 6392017 232 4 Arkansas AR South 2915918 93 5 California CA West 37253956 1257 6 Colorado CO West 5029196 65 7 Connecticut CT Northeast 3574097 97 8 Delaware DE South 897934 38 9 District of Columbia DC South 601723 99 10 Florida FL South 19687653 669 11 Georgia GA South 9920000 376 12 Hawaii HI West 1360301 7 13 Idaho ID West 1567582 12 14 Illinois IL North Central 12830632 364 15 Indiana IN North Central 6483802…A study on driving speed (miles per hour) and fuel efficiency (miles per gallon) for midsize automobiles resulted in the following data: Driving Speed 30 50 40 55 30 25 60 25 50 55 Fuel Efficiency 28 25 25 23 30 32 21 35 26 25 Construct a scatter diagram with driving speed on the horizontal axis and fuel efficiency on the vertical axis.