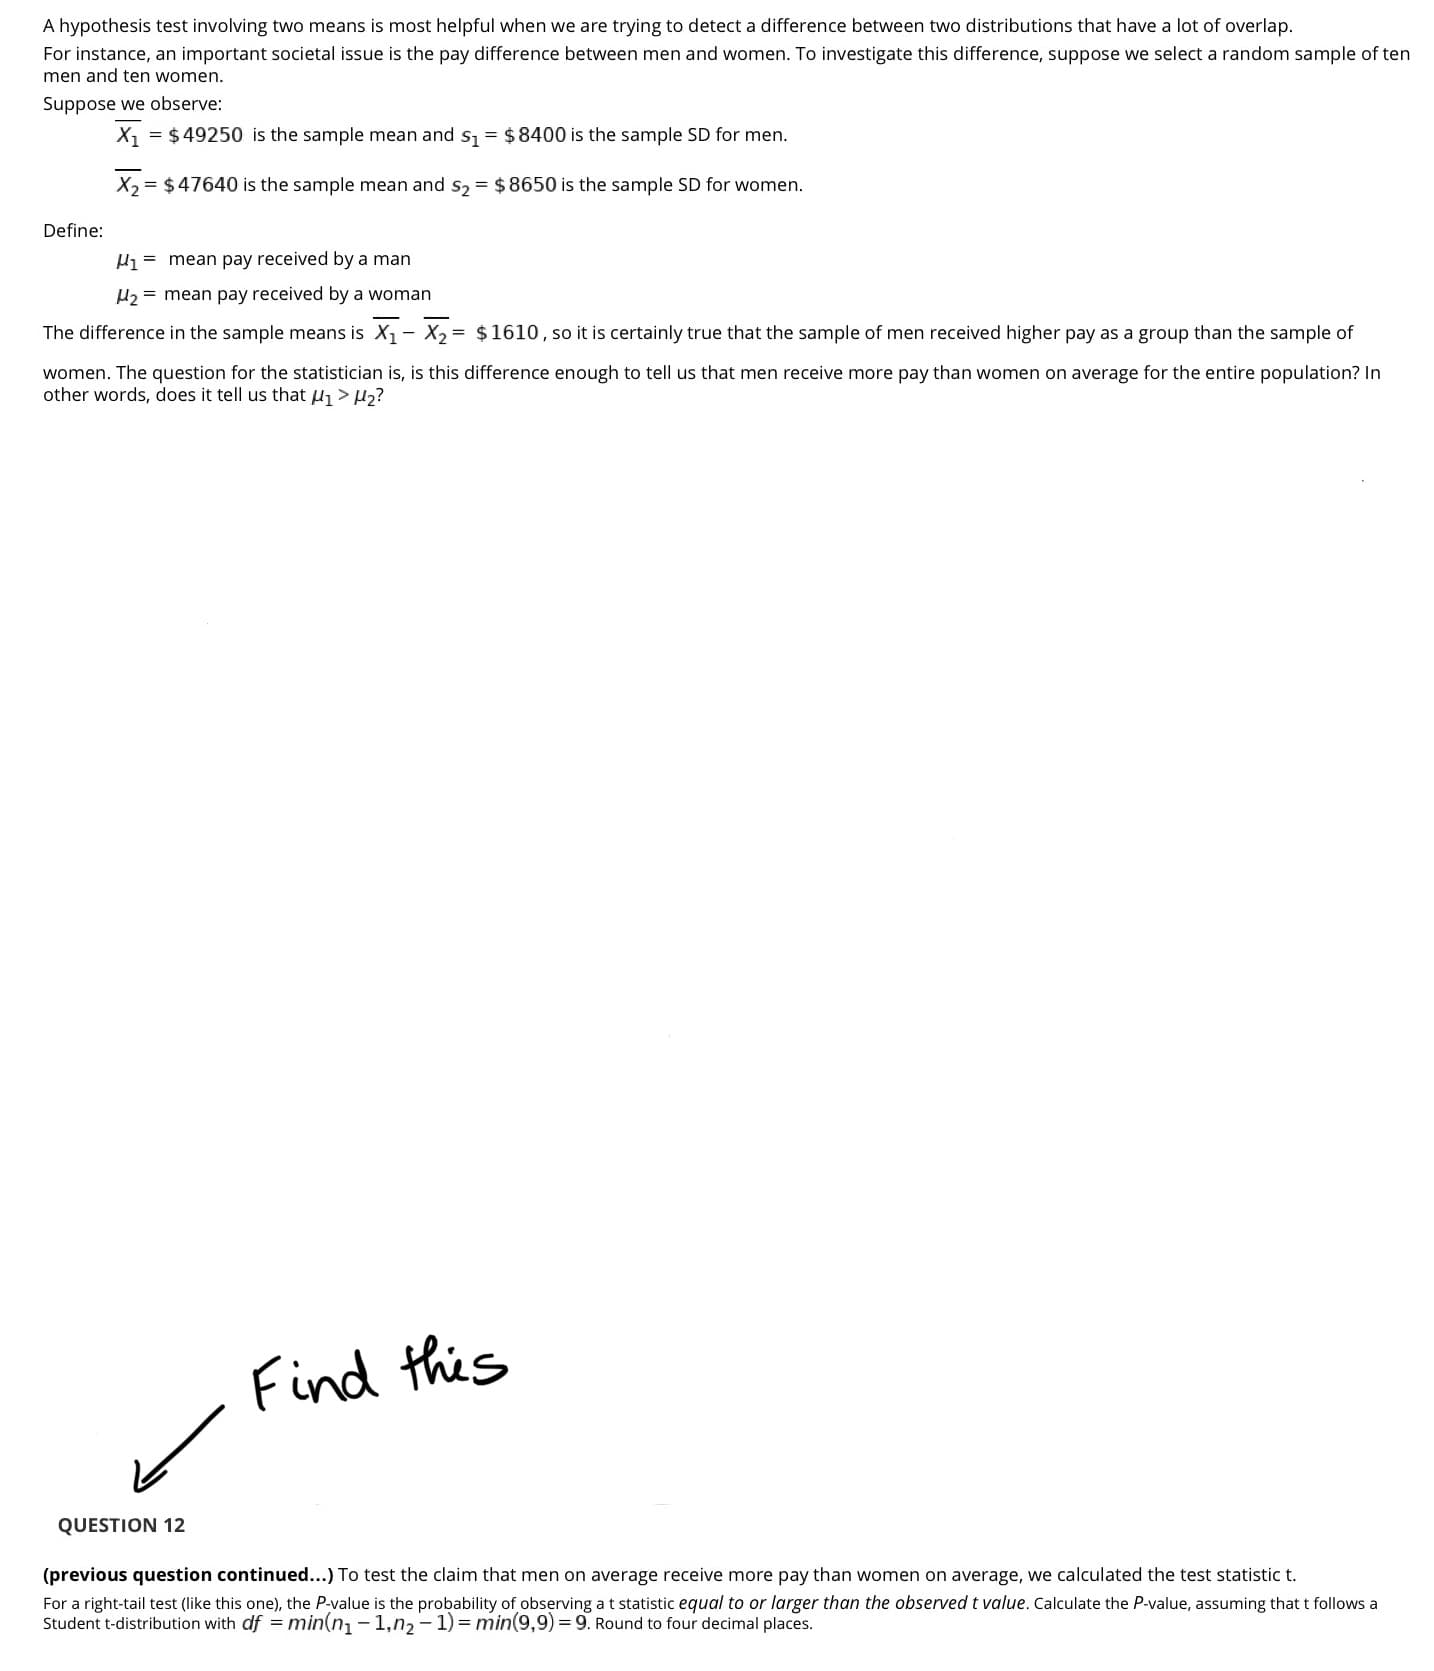
A hypothesis test involving two means is most helpful when we are trying to detect a difference between two distributions that have a lot of overlap. For instance, an important societal issue is the pay difference between men and women. To investigate this difference, suppose we select a random sample of ten men and ten women. Suppose we observe: X1 = $49250 is the sample mean and s, = $8400 is the sample SD for men. X2 = $47640 is the sample mean and s2 = $8650 is the sample SD for women. Define: H1 = mean pay received by a man H, = mean pay received by a woman The difference in the sample means is X1- X, = $1610, so it is certainly true that the sample of men received higher pay as a group than the sample of women. The question for the statistician is, is this difference enough to tell us that men receive more pay than women on average for the entire population? In other words, does it tell us that uj > µ,? Find this QUESTION 12 (previous question continued...) To test the claim that men on average receive more pay than women on average, we calculated the test statistic t. For a right-tail test (like this one), the P-value is the probability of observing at statistic equal to or larger than the observed t value. Calculate the P-value, assuming that t follows a Student t-distribution with df = min(n, - 1,n, - 1) = min(9,9)=9. Round to four decimal places.


Addition Rule of Probability
It simply refers to the likelihood of an event taking place whenever the occurrence of an event is uncertain. The probability of a single event can be calculated by dividing the number of successful trials of that event by the total number of trials.
Expected Value
When a large number of trials are performed for any random variable ‘X’, the predicted result is most likely the mean of all the outcomes for the random variable and it is known as expected value also known as expectation. The expected value, also known as the expectation, is denoted by: E(X).
Probability Distributions
Understanding probability is necessary to know the probability distributions. In statistics, probability is how the uncertainty of an event is measured. This event can be anything. The most common examples include tossing a coin, rolling a die, or choosing a card. Each of these events has multiple possibilities. Every such possibility is measured with the help of probability. To be more precise, the probability is used for calculating the occurrence of events that may or may not happen. Probability does not give sure results. Unless the probability of any event is 1, the different outcomes may or may not happen in real life, regardless of how less or how more their probability is.
Basic Probability
The simple definition of probability it is a chance of the occurrence of an event. It is defined in numerical form and the probability value is between 0 to 1. The probability value 0 indicates that there is no chance of that event occurring and the probability value 1 indicates that the event will occur. Sum of the probability value must be 1. The probability value is never a negative number. If it happens, then recheck the calculation.
Find Question 12

Step by step
Solved in 3 steps with 3 images


