A large automobile insurance company selected samples of single and married male policyholders and recorded the number who made an insurance claim over the preceding three-year period. Single Policyholders Married Policyholders n1 = 900 n, = 400 number making claims = 135 number making claims = 24 (a) Use a = 0.05. Test to determine whether the claim rates differ between single and married male policyholders. State the null and alternative hypotheses. (Let p, = claim rate for single male policyholders and p, = claim rate for married male policy holders.) Ho: P1 - P2 = 0 Hai P1 - P2 * 0 Ho: P1 - P2 + 0 Hại P1- P2 = 0 Ho: P1 - P2s0 Hai P1 - P2 > 0 Ho: P1 - P2 2 0 Hai P1 - P2 < 0 HoiP1- P2 > 0 Hai P1 - P2s0 Find the value of the test statistic. (Round your answer to two decimal places.) Find the p-value. (Round your answer to four decimal places.) p-value = State your conclusion. Do not reject Ho. We can conclude that there is a difference between claim rates. Do not reject Ho. We can not conclude that there is a difference between claim rates. O Reject Ho. We can conclude that there is a difference between claim rates. Reject Ho. We can not conclude that there is a difference between claim rates.
A large automobile insurance company selected samples of single and married male policyholders and recorded the number who made an insurance claim over the preceding three-year period. Single Policyholders Married Policyholders n1 = 900 n, = 400 number making claims = 135 number making claims = 24 (a) Use a = 0.05. Test to determine whether the claim rates differ between single and married male policyholders. State the null and alternative hypotheses. (Let p, = claim rate for single male policyholders and p, = claim rate for married male policy holders.) Ho: P1 - P2 = 0 Hai P1 - P2 * 0 Ho: P1 - P2 + 0 Hại P1- P2 = 0 Ho: P1 - P2s0 Hai P1 - P2 > 0 Ho: P1 - P2 2 0 Hai P1 - P2 < 0 HoiP1- P2 > 0 Hai P1 - P2s0 Find the value of the test statistic. (Round your answer to two decimal places.) Find the p-value. (Round your answer to four decimal places.) p-value = State your conclusion. Do not reject Ho. We can conclude that there is a difference between claim rates. Do not reject Ho. We can not conclude that there is a difference between claim rates. O Reject Ho. We can conclude that there is a difference between claim rates. Reject Ho. We can not conclude that there is a difference between claim rates.

MATLAB: An Introduction with Applications
6th Edition
ISBN:9781119256830
Author:Amos Gilat
Publisher:Amos Gilat
Chapter1: Starting With Matlab
Section: Chapter Questions
Problem 1P

Related questions
Question
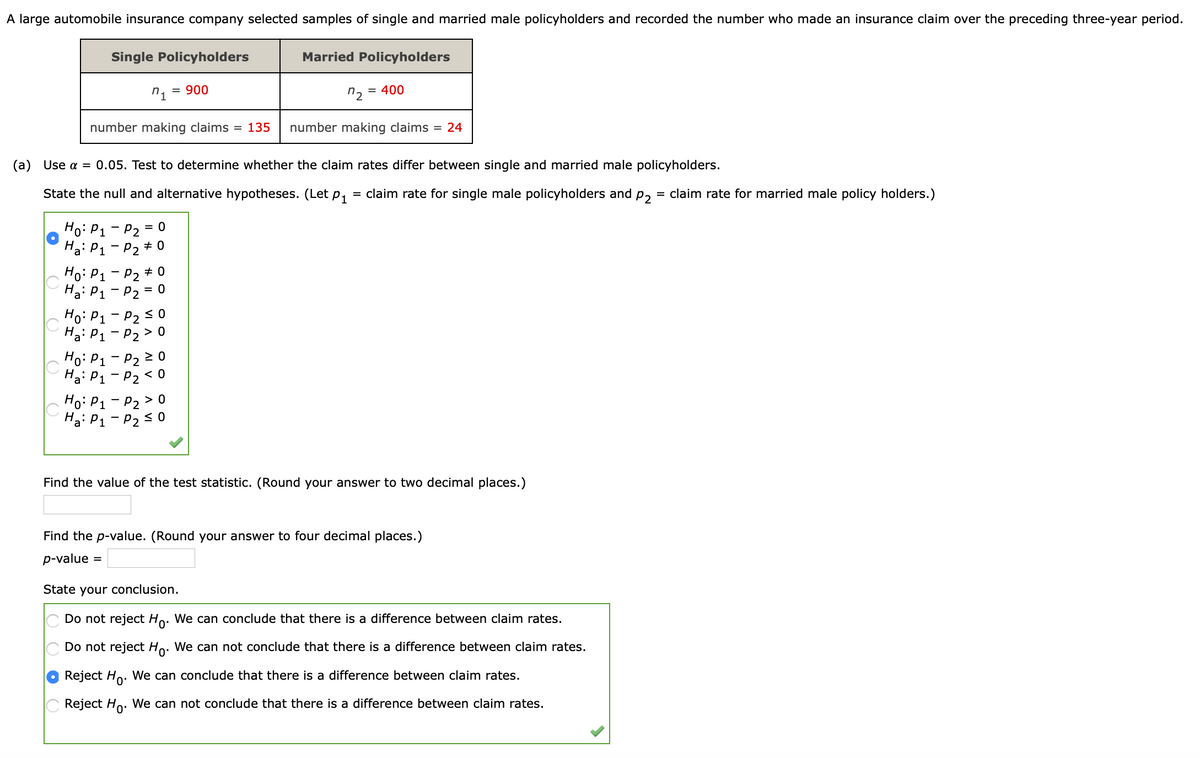
Transcribed Image Text:A large automobile insurance company selected samples of single and married male policyholders and recorded the number who made an insurance claim over the preceding three-year period.
Single Policyholders
Married Policyholders
n1
= 900
n2
= 400
number making claims = 135
number making claims = 24
(a) Use a = 0.05. Test to determine whether the claim rates differ between single and married male policyholders.
State the null and alternative hypotheses. (Let p, = claim rate for single male policyholders and
P2
= claim rate for married male policy holders.)
Ho: P1 - P2 = 0
Ha: P1 - P2 + 0
Ho: P1 - P2 + 0
Ha: P1 - P2 = 0
Ho: P1 - P2 < 0
Ha: P1 - P2 > 0
Ho: P1 - P2 2 0
Hai P1 - P2 < 0
Ho: P1 - P2 > 0
Ha: P1 - P2 <0
value
the
statistic. (Round your answer to
ecimal places.)
Find the p-value. (Round your answer to four decimal places.)
p-value =
State your conclusion.
Do not reject Ho. We can conclude that there is a difference between claim rates.
Do not reject Ho. We can not conclude that there is a difference between claim rates.
Reject Ho. We can conclude that there is a difference between claim rates.
Reject Ho. We can not conclude that there is a difference between claim rates.

Transcribed Image Text:(b) Provide a 95% confidence interval for the difference between the proportions for the two populations. (Round your answers to four decimal places.)
to
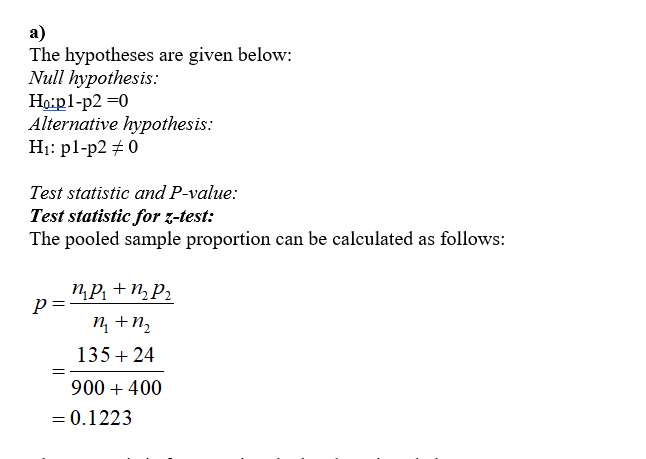
Expert Solution
Step 1

Trending now
This is a popular solution!

Step by step
Solved in 3 steps with 3 images

Recommended textbooks for you
MATLAB: An Introduction with Applications
Statistics
ISBN:
9781119256830
Author:
Amos Gilat
Publisher:
John Wiley & Sons Inc

Probability and Statistics for Engineering and th…
Statistics
ISBN:
9781305251809
Author:
Jay L. Devore
Publisher:
Cengage Learning

Statistics for The Behavioral Sciences (MindTap C…
Statistics
ISBN:
9781305504912
Author:
Frederick J Gravetter, Larry B. Wallnau
Publisher:
Cengage Learning
MATLAB: An Introduction with Applications
Statistics
ISBN:
9781119256830
Author:
Amos Gilat
Publisher:
John Wiley & Sons Inc
Probability and Statistics for Engineering and th…
Statistics
ISBN:
9781305251809
Author:
Jay L. Devore
Publisher:
Cengage Learning
Statistics for The Behavioral Sciences (MindTap C…
Statistics
ISBN:
9781305504912
Author:
Frederick J Gravetter, Larry B. Wallnau
Publisher:
Cengage Learning

Elementary Statistics: Picturing the World (7th E…
Statistics
ISBN:
9780134683416
Author:
Ron Larson, Betsy Farber
Publisher:
PEARSON

The Basic Practice of Statistics
Statistics
ISBN:
9781319042578
Author:
David S. Moore, William I. Notz, Michael A. Fligner
Publisher:
W. H. Freeman

Introduction to the Practice of Statistics
Statistics
ISBN:
9781319013387
Author:
David S. Moore, George P. McCabe, Bruce A. Craig
Publisher:
W. H. Freeman