A lecturer at WIN wanted to know if he can predict student’s quiz results by asking them to complete a simple survey. The result of the survey is found in the file: Assignment 2 sem22020 data set 1. Quiz Result Actual Mark (0-15) for quiz student attained EQR Quiz score (0-15) expected to get before taking the quiz Study Hrs. Number of hours per week (on average) spent studying for Statistics Age Age (in years) BBT Satisfaction rating of Big Bang Theory Sex M=1 F=0 MB MB=1 for good math background, otherwise 0 MC MC= 1 if math centre is used regularly, otherwise 0 AuHS AuHS = 1 if student completed high school in Australia, otherwise 0 LM LM=1 if student likes math, 0 otherwise Task 1: Variable List (a) Using the variables listed in the table above, Describe each variable. (b) State for each variable whether it is qualitative or quantitative; if it is qualitative, state whether it is nominal or ordinal, and if it is quantitative, state whether it is discrete or continuous. Task 2: Histogram Create a histogram showing the distribution of marks and study hours. Find the 5-number summary of the distribution of marks and study hours. Comment on the shape of the distribution: is it symmetrical? If it is not, is it positively or negatively skewed? Are there any outliers present? If so, are they of particular interest?


Contingency Table
A contingency table can be defined as the visual representation of the relationship between two or more categorical variables that can be evaluated and registered. It is a categorical version of the scatterplot, which is used to investigate the linear relationship between two variables. A contingency table is indeed a type of frequency distribution table that displays two variables at the same time.
Binomial Distribution
Binomial is an algebraic expression of the sum or the difference of two terms. Before knowing about binomial distribution, we must know about the binomial theorem.
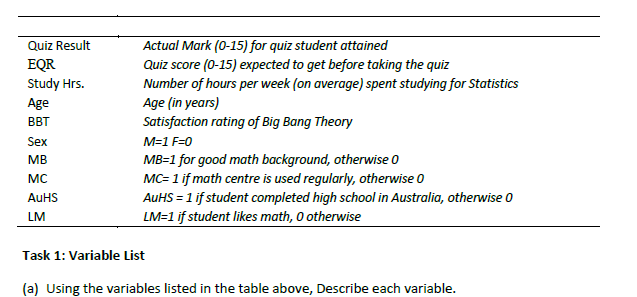
A lecturer at WIN wanted to know if he can predict student’s quiz results by asking them to complete a simple survey. The result of the survey is found in the file: Assignment 2 sem22020 data set 1.
Quiz Result
Actual Mark (0-15) for quiz student attained
EQR
Quiz score (0-15) expected to get before taking the quiz
Study Hrs.
Number of hours per week (on average) spent studying for Statistics
Age
Age (in years)
BBT
Satisfaction rating of Big Bang Theory
Sex
M=1 F=0
MB
MB=1 for good math background, otherwise 0
MC
MC= 1 if math centre is used regularly, otherwise 0
AuHS
AuHS = 1 if student completed high school in Australia, otherwise 0
LM
LM=1 if student likes math, 0 otherwise
Task 1: Variable List
(a) Using the variables listed in the table above, Describe each variable.
(b) State for each variable whether it is qualitative or quantitative; if it is qualitative, state whether it is nominal or ordinal, and if it is quantitative, state whether it is discrete or continuous.
Task 2: Histogram
Create a histogram showing the distribution of marks and study hours. Find the 5-number summary of the distribution of marks and study hours. Comment on the shape of the distribution: is it symmetrical? If it is not, is it positively or negatively skewed? Are there any outliers present? If so, are they of particular interest?
Task 3:
(a) Run a regression of Quiz results on EQR. Formulate a hypothesis test to determine if EQR is a significant factor in determining quiz results.
(b) Interpret the above regression
(c) Run a regression of Quiz results on EQR, study hours, age and sex. Is this a better or worse model. Explain
(d) Are all variables significant determinants? Explain
(e) Interpret the regression from part c
(f) Run a regression of Quiz results on all the listed variables. Are they all statistically significant? Determine the best model to help predict quiz results.
Task 5: Regression Analysis
The lecturer is interested to see what variables, if any will help determine the number of hours spent on studying statistics. Test and find any regression models that can help determine the number of hours spent on studying. (Hint run Study hrs. on…)
(a) On average, how much do males study more(less) than females?
(b) Do people who enjoy the Big Bang Theory impact on the number of hours studies?
(c) Is age a determining factor on the number of hours studied?
(d) Do students with a stronger math background study more or less? Also state how much more or less


Trending now
This is a popular solution!

Step by step
Solved in 4 steps


