A new thermostat has been engineered for the frozen food cases in large supermarkets. Both the old and new thermostats hold temperatures at an average of 25°F. However, it is hoped that the new thermostat might be more dependable in the sense that it will hold temperatures closer to 25°F. One frozen food case was equipped with the new thermostat, and a random sample of 26 temperature readings gave a sample variance of 4.2. Another similar frozen food case was equipped with the old thermostat, and a random sample of 16 temperature readings gave a sample variance of 12.6. Test the claim that the population variance of the old thermostat temperature readings is larger than that for the new thermostat. Use a 5% level of significance. How could your test conclusion relate to the question regarding the dependability of the temperature readings? (Let population refer to data from the old thermostat.) (a) What is the level of significance? State the null and alternate hypotheses. O Hoi 0,? = 0,²; H,:0,² > o,² O Ho: 0,? = 0,²; Hz: 0,? < 0z? O Ho: 0,? = 0,²; Hq: 0,² + 0z² O Ho: 0,? > 0,²; H;: 0,² = 0, (b) Find the value of the sample F statistic. (Round your answer to two decimal places.) What are the degrees of freedom? dfy = df, = What assumptions are you making about the original distribution? O The populations follow independent normal distributions. O The populations follow independent chi-square distributions. We have random samples from each population. O The populations follow independent normal distributions. We have random samples from each population. O The populations follow dependent normal distributions. We have random samples from each population. (c) Find or estimate the P-value of the sample test statistic. (Round your answer to four decimal places.) O p-value > 0.100 O 0.050 < p-value < 0.100 O 0.025 < p-value < 0.050 O 0.010 < p-value < 0.025 O 0.001 < p-value < 0.010
A new thermostat has been engineered for the frozen food cases in large supermarkets. Both the old and new thermostats hold temperatures at an average of 25°F. However, it is hoped that the new thermostat might be more dependable in the sense that it will hold temperatures closer to 25°F. One frozen food case was equipped with the new thermostat, and a random sample of 26 temperature readings gave a sample variance of 4.2. Another similar frozen food case was equipped with the old thermostat, and a random sample of 16 temperature readings gave a sample variance of 12.6. Test the claim that the population variance of the old thermostat temperature readings is larger than that for the new thermostat. Use a 5% level of significance. How could your test conclusion relate to the question regarding the dependability of the temperature readings? (Let population refer to data from the old thermostat.) (a) What is the level of significance? State the null and alternate hypotheses. O Hoi 0,? = 0,²; H,:0,² > o,² O Ho: 0,? = 0,²; Hz: 0,? < 0z? O Ho: 0,? = 0,²; Hq: 0,² + 0z² O Ho: 0,? > 0,²; H;: 0,² = 0, (b) Find the value of the sample F statistic. (Round your answer to two decimal places.) What are the degrees of freedom? dfy = df, = What assumptions are you making about the original distribution? O The populations follow independent normal distributions. O The populations follow independent chi-square distributions. We have random samples from each population. O The populations follow independent normal distributions. We have random samples from each population. O The populations follow dependent normal distributions. We have random samples from each population. (c) Find or estimate the P-value of the sample test statistic. (Round your answer to four decimal places.) O p-value > 0.100 O 0.050 < p-value < 0.100 O 0.025 < p-value < 0.050 O 0.010 < p-value < 0.025 O 0.001 < p-value < 0.010

Algebra & Trigonometry with Analytic Geometry
13th Edition
ISBN:9781133382119
Author:Swokowski
Publisher:Swokowski
Chapter5: Inverse, Exponential, And Logarithmic Functions
Section5.6: Exponential And Logarithmic Equations
Problem 64E

Related questions
Topic Video
Question
Transcribed Image Text:W Math 2250 Unit 4 Post Test Re X
b Statistics Question | bartleby
x +
->
webassign.net/web/Student/Assignment-Responses/last?dep=24515412
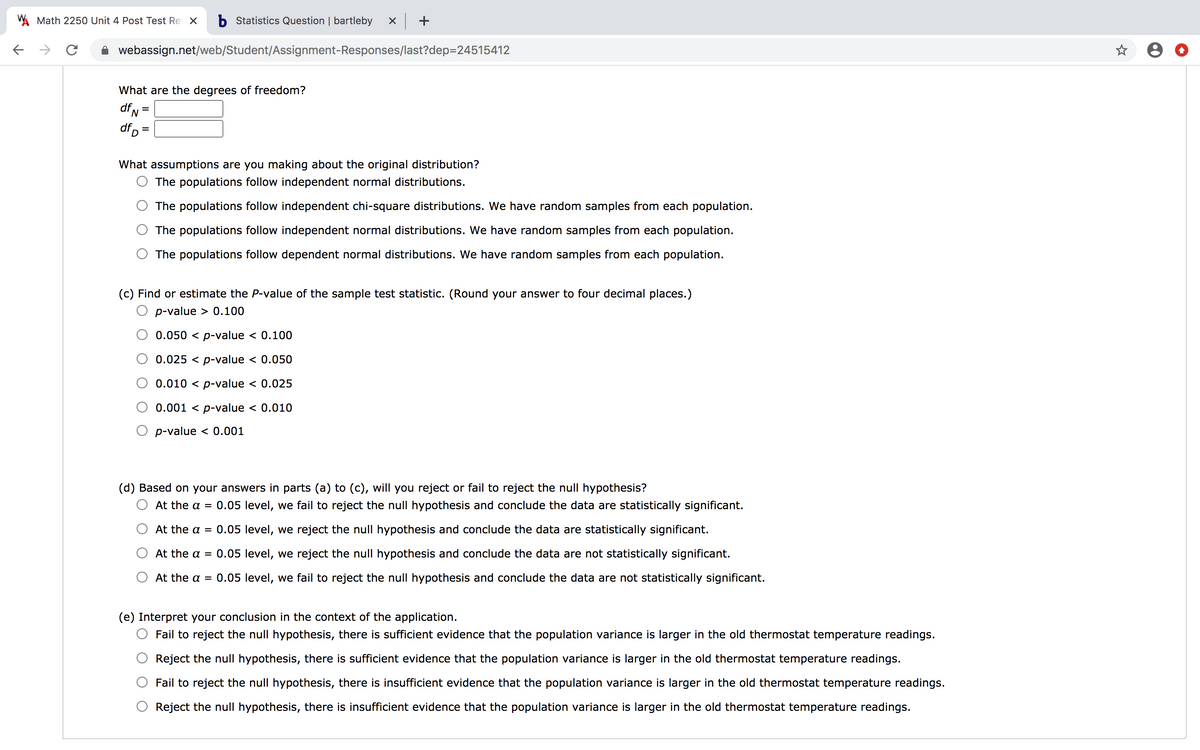
What are the degrees of freedom?
df
N
dfp
What assumptions are you making about the original distribution?
O The populations follow independent normal distributions.
The populations follow independent chi-square distributions. We have random samples from each population.
The populations follow independent normal distributions. We have random samples from each population.
The populations follow dependent normal distributions. We have random samples from each population.
(c) Find or estimate the P-value of the sample test statistic. (Round your answer to four decimal places.)
O p-value > 0.100
0.050 < p-value < 0.100
0.025 < p-value < 0.050
0.010 < p-value < 0.025
0.001 < p-value < 0.010
O p-value < 0.001
(d) Based on your answers in parts (a) to (c), will you reject or fail to reject the null hypothesis?
At the a = 0.05 level, we fail to reject the null hypothesis and conclude the data are statistically significant.
At the a = 0.05 level, we reject the null hypothesis and conclude the data are statistically significant.
At the a = 0.05 level, we reject the null hypothesis and conclude the data are not statistically significant.
At the a = 0.05 level, we fail to reject the null hypothesis and conclude the data are not statistically significant.
(e) Interpret your conclusion in the context of the application.
O Fail to reject the null hypothesis, there is sufficient evidence that the population variance is larger in the old thermostat temperature readings.
Reject the null hypothesis, there is sufficient evidence that the population variance is larger in the old thermostat temperature readings.
Fail to reject the null hypothesis, there is insufficient evidence that the population variance is larger in the old thermostat temperature readings.
ject the null hyp
esis, there is insufficient evidence that the population variance is larger in the old thermostat temperature
adings.
Transcribed Image Text:W Math 2250 Unit 4 Post Test Re X
b Statistics Question | bartleby
->
webassign.net/web/Student/Assignment-Responses/last?dep=24515412
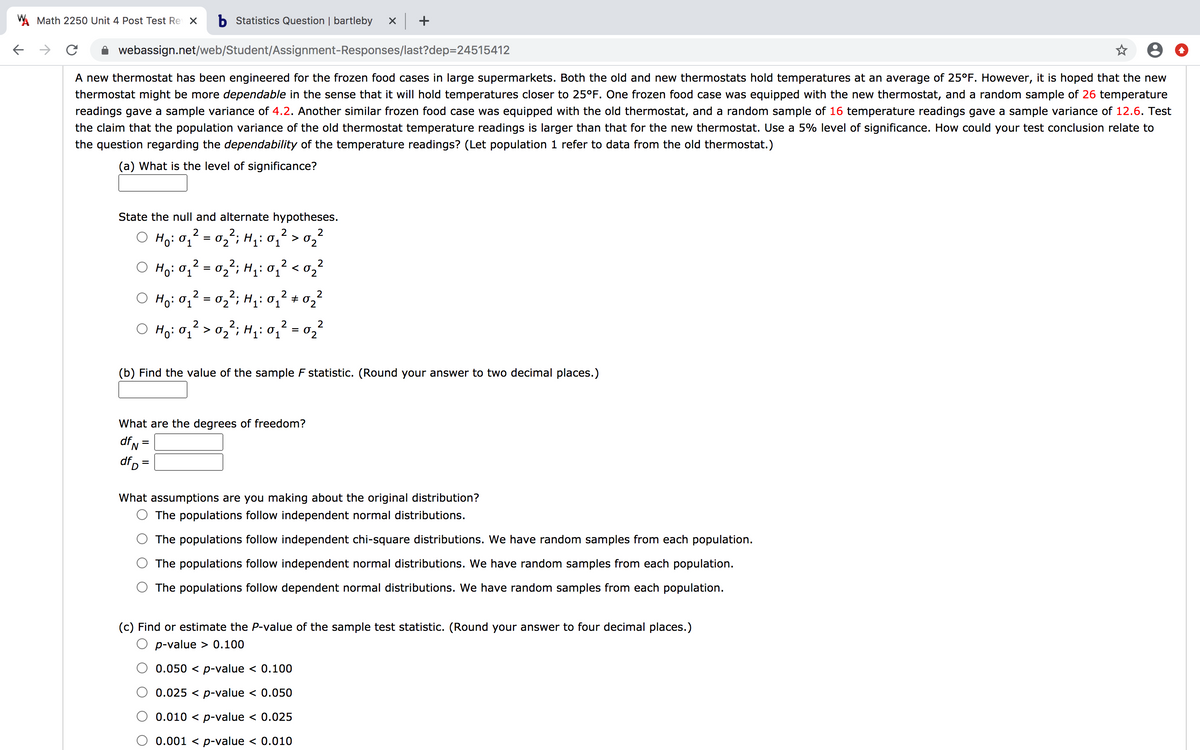
A new thermostat has been engineered for the frozen food cases in large supermarkets. Both the old and new thermostats hold temperatures at an average of 25°F. However, it is hoped that the new
thermostat might be more dependable in the sense that it will hold temperatures closer to 25°F. One frozen food case was equipped with the new thermostat, and a random sample of 26 temperature
readings gave a sample variance of 4.2. Another similar frozen food case was equipped with the old thermostat, and a random sample of 16 temperature readings gave a sample variance of 12.6. Test
the claim that the population variance of the old thermostat temperature readings is larger than that for the new thermostat. Use a 5% level of significance. How could your test conclusion relate to
the question regarding the dependability of the temperature readings? (Let population 1 refer to data from the old thermostat.)
(a) What is the level of significance?
State the null and alternate hypotheses.
O Ho: 01
- 02`; H,: 0.
2
2
> 02
%D
Ho: 0,2 = 0,2; H,: 0,? < 0,²
%3D
2
2
Ho:0, = 02'; H: 0,² + 02²
O Hoi O;?> 0;²; H;: 0,² = 0,?
2
2
Ho: 0; > 0,; H,: 01
(b) Find the value of the sample F statistic. (Round your answer to two decimal places.)
What are the degrees of freedom?
df,
df, =
What assumptions are you making about the original distribution?
The populations follow independent normal distributions.
The populations follow independent chi-square distributions. We have random samples from each population.
The populations follow independent normal distributions. We have random samples from each population.
The populations follow dependent normal distributions. We have random samples from each population.
(c) Find or estimate the P-value of the sample test statistic. (Round your answer to four decimal places.)
p-value > 0.100
0.050 < p-value < 0.100
0.025 < p-value < 0.050
0.010 < p-value < 0.025
0.001 < p-value < 0.010
Expert Solution
This question has been solved!
Explore an expertly crafted, step-by-step solution for a thorough understanding of key concepts.

This is a popular solution!

Trending now
This is a popular solution!

Step by step
Solved in 6 steps

Knowledge Booster


Learn more about
Need a deep-dive on the concept behind this application? Look no further. Learn more about this topic, statistics and related others by exploring similar questions and additional content below.Recommended textbooks for you
Algebra & Trigonometry with Analytic Geometry
Algebra
ISBN:
9781133382119
Author:
Swokowski
Publisher:
Cengage

Trigonometry (MindTap Course List)
Trigonometry
ISBN:
9781337278461
Author:
Ron Larson
Publisher:
Cengage Learning

Algebra & Trigonometry with Analytic Geometry
Algebra
ISBN:
9781133382119
Author:
Swokowski
Publisher:
Cengage
Trigonometry (MindTap Course List)
Trigonometry
ISBN:
9781337278461
Author:
Ron Larson
Publisher:
Cengage Learning