(a) Only 355 of the 1,000 respondents chose the correct answer of "never." Assume that the sample is representative of adult Americans. Is there convincing evidence that the proportion of adult Americans who can answer this question correctly is less than 0.40 (40%)? Use the five-step process for hypothesis testing (HMC) described in this section and a = 0.05 to test the appropriate hypotheses. (Hint: See Example 10.13.) State the appropriate null and alternative hypotheses. O Ho: p < 0.40 versus H: p > 0.40 O Ho: p = 0.40 versus H: p + 0.40 O Họ: p = 0.40 versus H: p < 0.40 Ho: p + 0.40 versus H: p = 0.40 O Ho: p = 0.40 versus H: p > 0.40 Find the test statistic and P-value. (Use a table or SALT. Round your test statistic to two decimal places and your P-value to four decimal places.) z = P-value = State the conclusion in the problem context. Fail to reject H. We do not have convincing evidence that the proportion of all adult Americans who would answer the question correctly is less than 0.40. O Reject Ho. We do not have convincing evidence that the proportion of all adult Americans who would answer the question correctly is less than 0.40. O Fail to reject H. We have convincing evidence that the proportion of all adult Americans who would answer the question correctly is less than 0.40. O Reject H. We have convincing evidence that the proportion of all adult Americans who would answer the question correctly is less than 0.40.
(a) Only 355 of the 1,000 respondents chose the correct answer of "never." Assume that the sample is representative of adult Americans. Is there convincing evidence that the proportion of adult Americans who can answer this question correctly is less than 0.40 (40%)? Use the five-step process for hypothesis testing (HMC) described in this section and a = 0.05 to test the appropriate hypotheses. (Hint: See Example 10.13.) State the appropriate null and alternative hypotheses. O Ho: p < 0.40 versus H: p > 0.40 O Ho: p = 0.40 versus H: p + 0.40 O Họ: p = 0.40 versus H: p < 0.40 Ho: p + 0.40 versus H: p = 0.40 O Ho: p = 0.40 versus H: p > 0.40 Find the test statistic and P-value. (Use a table or SALT. Round your test statistic to two decimal places and your P-value to four decimal places.) z = P-value = State the conclusion in the problem context. Fail to reject H. We do not have convincing evidence that the proportion of all adult Americans who would answer the question correctly is less than 0.40. O Reject Ho. We do not have convincing evidence that the proportion of all adult Americans who would answer the question correctly is less than 0.40. O Fail to reject H. We have convincing evidence that the proportion of all adult Americans who would answer the question correctly is less than 0.40. O Reject H. We have convincing evidence that the proportion of all adult Americans who would answer the question correctly is less than 0.40.

Chapter12: Sequences, Series And Binomial Theorem
Section12.3: Geometric Sequences And Series
Problem 12.58TI: What is the total effect on the economy of a government tax rebate of $500 to each household in...

Related questions
Question
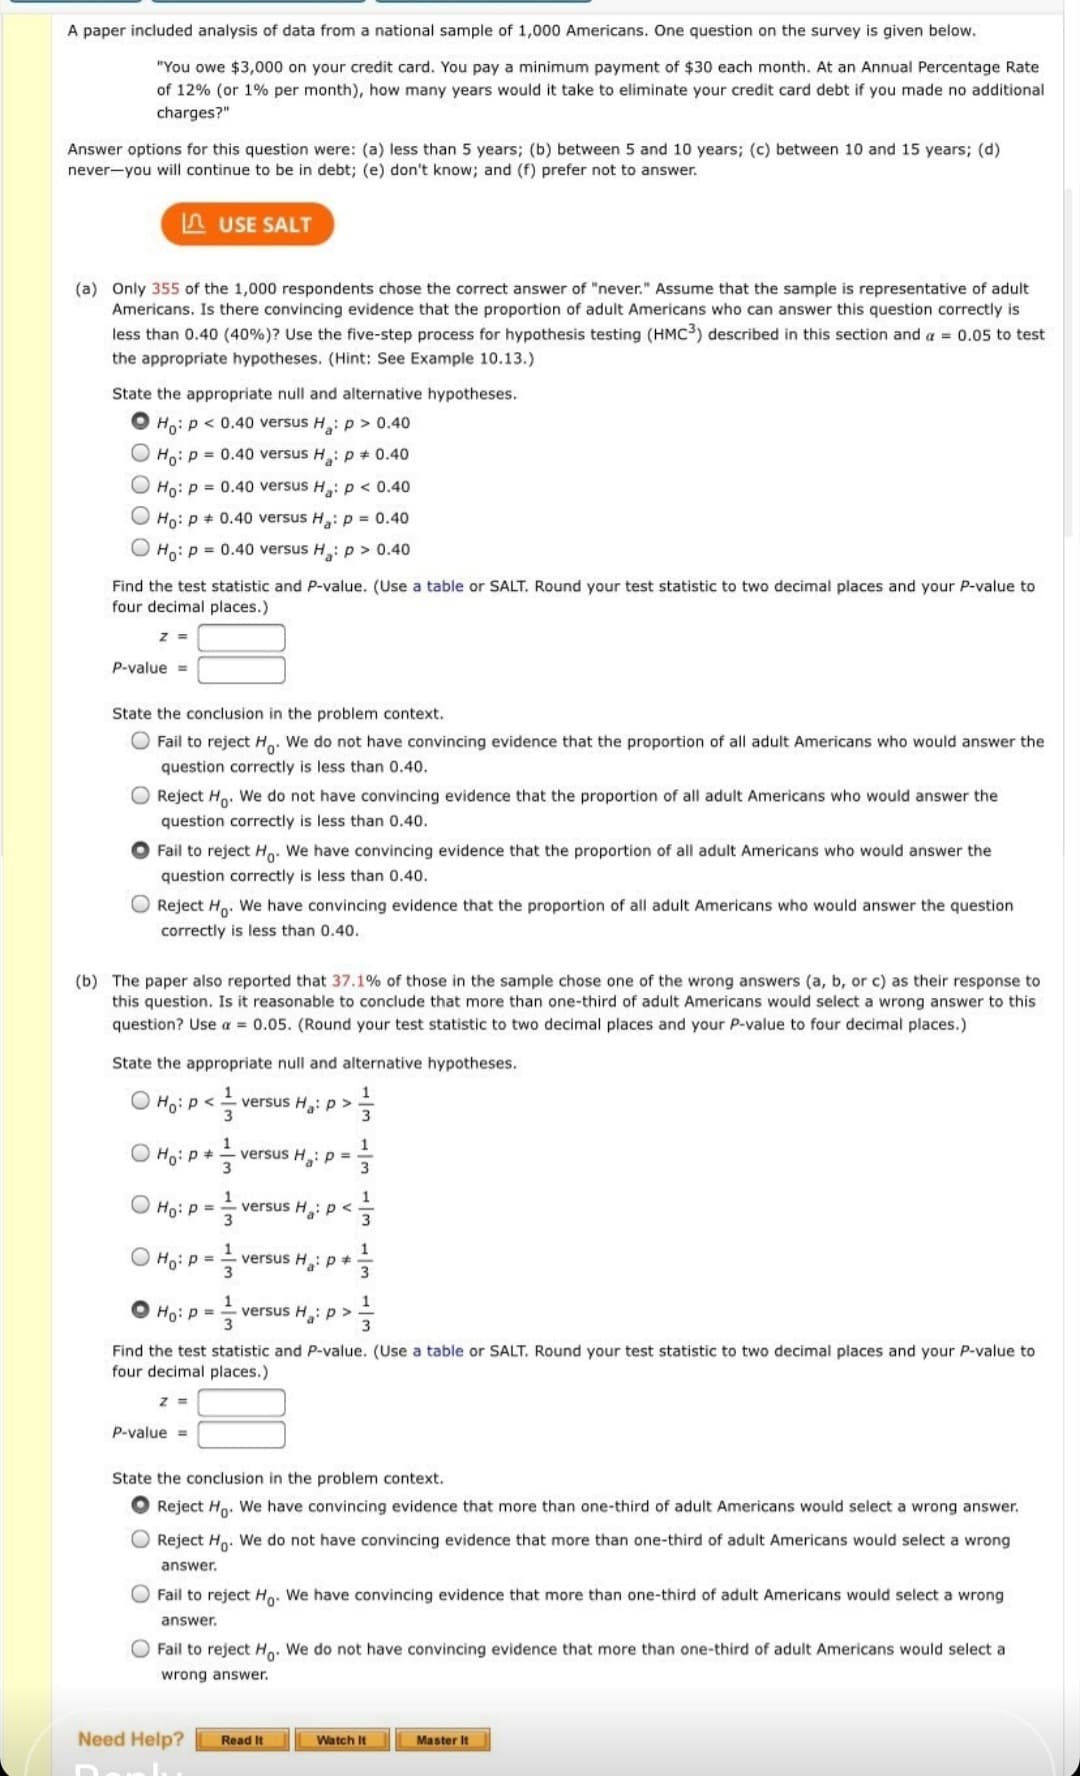
Transcribed Image Text:A paper included analysis of data from a national sample of 1,000 Americans. One question on the survey is given below.
"You owe $3,000 on your credit card. You pay a minimum payment of $30 each month. At an Annual Percentage Rate
of 12% (or 1% per month), how many years would it take to eliminate your credit card debt if you made no additional
charges?"
Answer options for this question were: (a) less than 5 years; (b) between 5 and 10 years; (c) between 10 and 15 years; (d)
never-you will continue to be in debt; (e) don't know; and (f) prefer not to answer.
A USE SALT
(a) Only 355 of the 1,000 respondents chose the correct answer of "never." Assume that the sample is representative of adult
Americans. Is there convincing evidence that the proportion of adult Americans who can answer this question correctly is
less than 0.40 (40%)? Use the five-step process for hypothesis testing (HMC3) described in this section and a = 0.05 to test
the appropriate hypotheses. (Hint: See Example 10.13.)
State the appropriate null and alternative hypotheses.
O Ho: p < 0.40 versus H: p > 0.40
O Ho: p = 0.40 versus H: p + 0.40
O Ho: p = 0.40 versus H: p < 0.40
Ho: p + 0.40 versus H: p = 0.40
O Ho: p = 0.40 versus H: p> 0.40
Find the test statistic and P-value. (Use a table or SALT. Round your test statistic to two decimal places and your P-value to
four decimal places.)
z =
P-value =
State the conclusion in the problem context.
O Fail to reject H. We do not have convincing evidence that the proportion of all adult Americans who would answer the
question correctly is less than 0.40.
O Reject Ho. We do not have convincing evidence that the proportion of all adult Americans who would answer the
question correctly is less than 0.40.
O Fail to reject Hg. We have convincing evidence that the proportion of all adult Americans who would answer the
question correctly is less than 0.40.
O Reject Ho. We have convincing evidence that the proportion of all adult Americans who would answer the question
correctly is less than 0.40.
(b) The paper also reported that 37.1% of those in the sample chose one of the wrong answers (a, b, or c) as their response to
this question. Is it reasonable to conclude that more than one-third of adult Americans would select a wrong answer to this
question? Use a = 0.05. (Round your test statistic to two decimal places and your P-value to four decimal places.)
State the appropriate null and alternative hypotheses.
O Ho: p<.
1
versus H: p >
3
O Ho: p +
1
versus H:p =
3
3
1
versus H: p <
3
1
O Ho: p =
3
1
= d:°H
versus H: p +
Ho: p =
versus H: p >-
Find the test statistic and P-value. (Use a table or SALT. Round your test statistic to two decimal places and your P-value to
four decimal places.)
P-value =
State the conclusion in the problem context.
O Reject Ho. We have convincing evidence that more than one-third of adult Americans would select a wrong answer.
O Reject Ho. We do not have convincing evidence that more than one-third of adult Americans would select a wrong
answer.
O Fail to reject Ho. We have convincing evidence that more than one-third of adult Americans would select a wrong
answer.
O Fail to reject H. We do not have convincing evidence that more than one-third of adult Americans would select a
wrong answer.
Need Help?
Master It
Read It
Watch It
1/3
Expert Solution
This question has been solved!
Explore an expertly crafted, step-by-step solution for a thorough understanding of key concepts.

This is a popular solution!

Trending now
This is a popular solution!

Step by step
Solved in 2 steps

Recommended textbooks for you