A random sample of n1 = 10 regions in New England gave the following violent crime rates (per million population). X1: New England Crime Rate 3.3 3.9 4.0 4.1 3.3 4.1 1.8 4.8 2.9 3.1 Another random sample of n2 = 12 regions in the Rocky Mountain states gave the following violent crime rates (per million population). X2: Rocky Mountain Crime Rate 3.7 4.1 4.5 5.1 3.3 4.8 3.5 2.4 3.1 3.5 5.2 2.8 Assume that the crime rate distribution is approximately normal in both regions. (i) Use a calculator to calculate x1, S1, X2, and s2. (Round your answers to three decimal places.) X1 = S1 = X2 = S2 = (ii) Do the data indicate that the violent crime rate in the Rocky Mountain region is higher than in New England? Use a = 0.01. (a) What is the level of significance?
A random sample of n1 = 10 regions in New England gave the following violent crime rates (per million population). X1: New England Crime Rate 3.3 3.9 4.0 4.1 3.3 4.1 1.8 4.8 2.9 3.1 Another random sample of n2 = 12 regions in the Rocky Mountain states gave the following violent crime rates (per million population). X2: Rocky Mountain Crime Rate 3.7 4.1 4.5 5.1 3.3 4.8 3.5 2.4 3.1 3.5 5.2 2.8 Assume that the crime rate distribution is approximately normal in both regions. (i) Use a calculator to calculate x1, S1, X2, and s2. (Round your answers to three decimal places.) X1 = S1 = X2 = S2 = (ii) Do the data indicate that the violent crime rate in the Rocky Mountain region is higher than in New England? Use a = 0.01. (a) What is the level of significance?

Holt Mcdougal Larson Pre-algebra: Student Edition 2012
1st Edition
ISBN:9780547587776
Author:HOLT MCDOUGAL
Publisher:HOLT MCDOUGAL
Chapter11: Data Analysis And Probability
Section: Chapter Questions
Problem 8CR

Related questions

Topic Video
Question
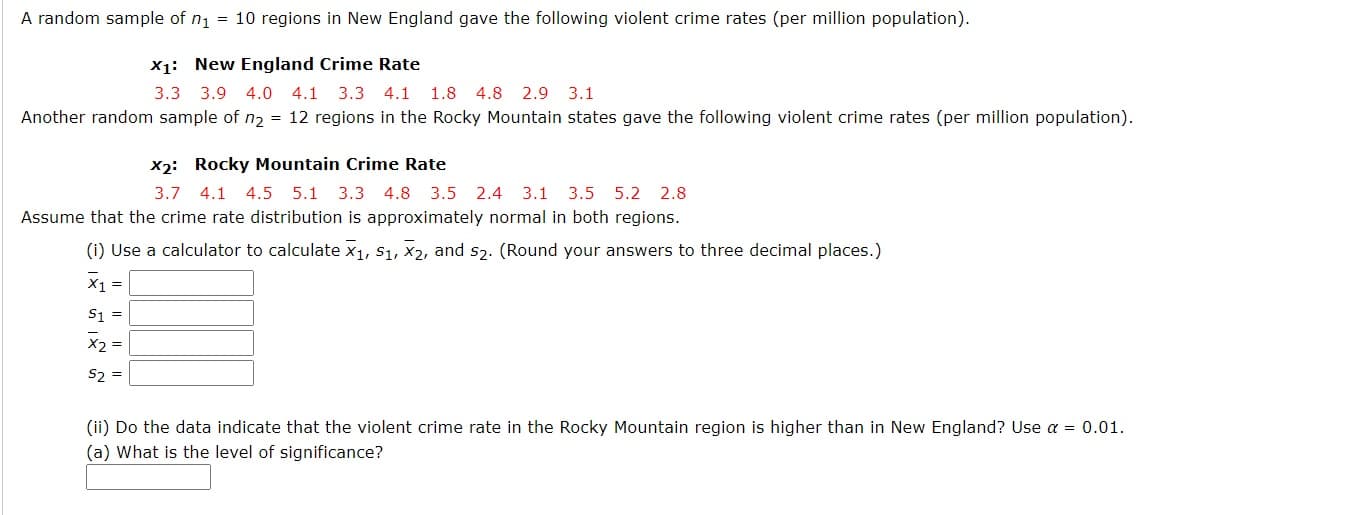
Transcribed Image Text:A random sample of n1 = 10 regions in New England gave the following violent crime rates (per million population).
X1: New England Crime Rate
3.3 3.9 4.0 4.1 3.3 4.1
1.8 4.8
2.9 3.1
Another random sample of n2 = 12 regions in the Rocky Mountain states gave the following violent crime rates (per million population).
X2: Rocky Mountain Crime Rate
3.7 4.1 4.5 5.1 3.3 4.8
3.5 2.4 3.1 3.5 5.2 2.8
Assume that the crime rate distribution is approximately normal in both regions.
(i) Use a calculator to calculate x1, S1, X2, and s2. (Round your answers to three decimal places.)
X1 =
S1 =
X2 =
S2 =
(ii) Do the data indicate that the violent crime rate in the Rocky Mountain region is higher than in New England? Use a = 0.01.
(a) What is the level of significance?

Expert Solution
This question has been solved!
Explore an expertly crafted, step-by-step solution for a thorough understanding of key concepts.

This is a popular solution!

Trending now
This is a popular solution!

Step by step
Solved in 3 steps

Knowledge Booster


Learn more about
Need a deep-dive on the concept behind this application? Look no further. Learn more about this topic, statistics and related others by exploring similar questions and additional content below.Recommended textbooks for you
Holt Mcdougal Larson Pre-algebra: Student Edition…
Algebra
ISBN:
9780547587776
Author:
HOLT MCDOUGAL
Publisher:
HOLT MCDOUGAL
Holt Mcdougal Larson Pre-algebra: Student Edition…
Algebra
ISBN:
9780547587776
Author:
HOLT MCDOUGAL
Publisher:
HOLT MCDOUGAL