A researcher is analyzing the relationship between various variables in housing data for 32 cities: median list prices of single family homes, condominium or co-ops, all homes, median household income, unemployment rate, and population. What is the correlation coefficient R for the model that predicts the list price of single family homes using population as an explanatory variable? R= Ex: 1.234 What is the interpretation of this correlation coefficient in context? A Pick moderate strong weak correlation exists between the list price of single family homes and population.
A researcher is analyzing the relationship between various variables in housing data for 32 cities: median list prices of single family homes, condominium or co-ops, all homes, median household income, unemployment rate, and population. What is the correlation coefficient R for the model that predicts the list price of single family homes using population as an explanatory variable? R= Ex: 1.234 What is the interpretation of this correlation coefficient in context? A Pick moderate strong weak correlation exists between the list price of single family homes and population.

Glencoe Algebra 1, Student Edition, 9780079039897, 0079039898, 2018
18th Edition
ISBN:9780079039897
Author:Carter
Publisher:Carter
Chapter4: Equations Of Linear Functions
Section4.5: Correlation And Causation
Problem 15PPS

Related questions
Question
Please answer both parts
Thank you
Transcribed Image Text:2:34 OODU
UG 96%
cityhomes (1)
fx
A
B
D
E
F
H
1
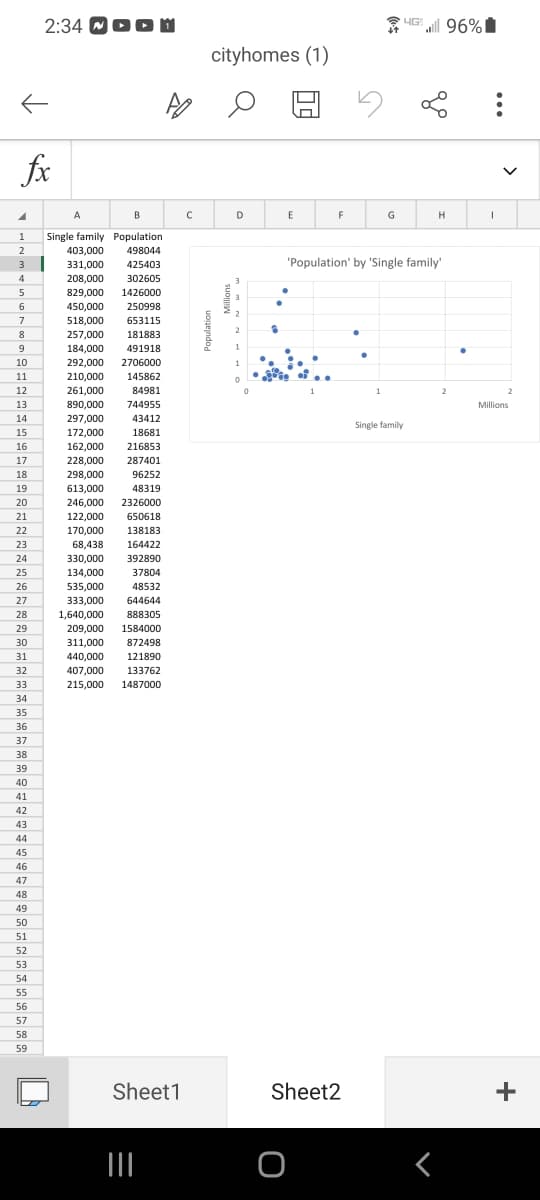
Single family Population
2
403,000
498044
'Population' by 'Single family'
331,000
208,000
829,000
3
425403
4
302605
1426000
450,000
250998
518,000
257,000
7
653115
181883
184,000
491918
10
292,000
2706000
1
210,000
261,000
11
145862
12
84981
13
890,000
744955
Millions
14
297,000
43412
Single family
15
172,000
18681
16
162,000
216853
17
228,000
287401
18
298,000
96252
19
613,000
48319
20
246,000
2326000
21
122,000
650618
22
170,000
138183
23
68,438
164422
24
330,000
392890
134,000
535,000
25
37804
26
48532
27
333,000
644644
28
1,640,000
888305
29
209,000
1584000
311,000
440,000
30
872498
31
121890
32
407,000
215,000
133762
33
1487000
34
35
36
37
38
39
40
41
42
43
44
45
46
47
48
49
50
51
52
53
54
55
56
57
58
59
Sheet1
Sheet2
+
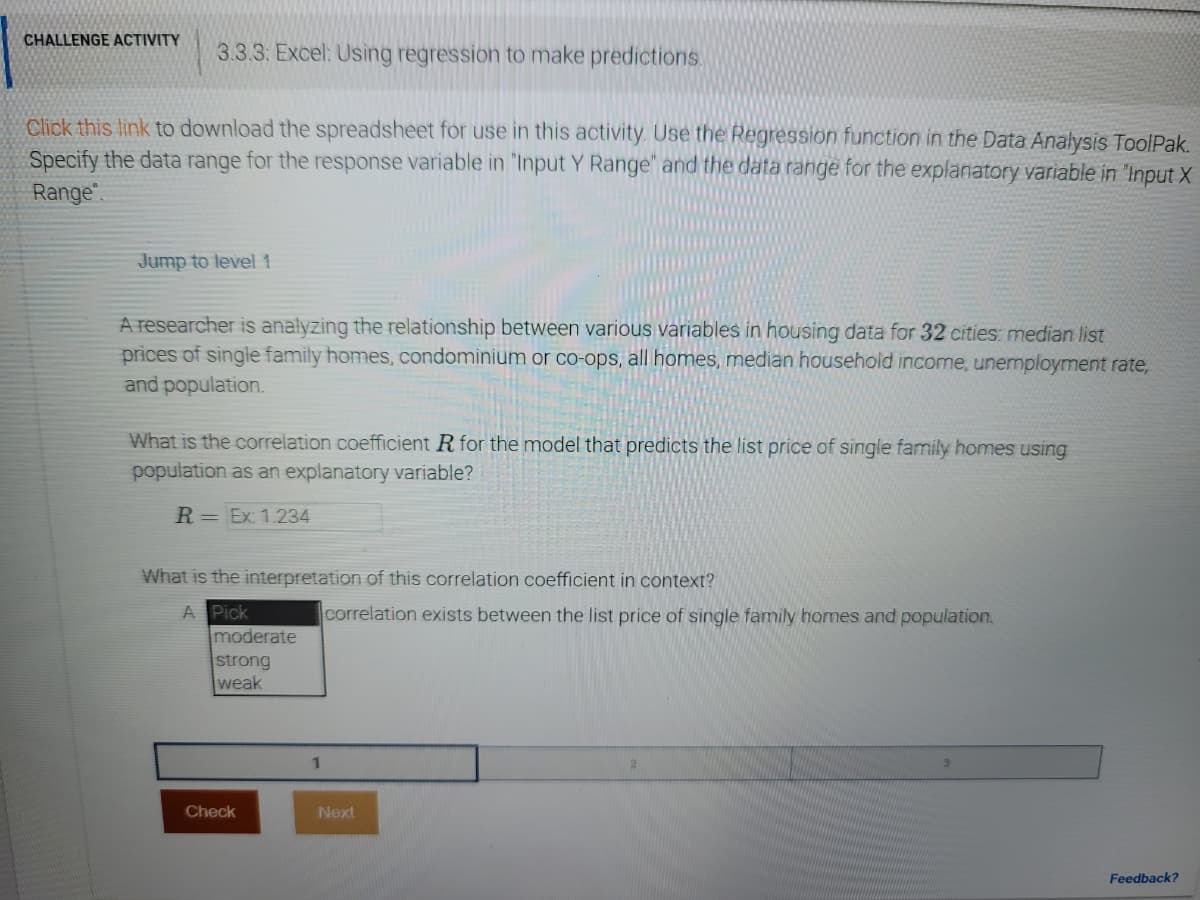
Transcribed Image Text:CHALLENGE ACTIVITY
3.3.3: Excel: Using regression to make predictions.
Click this link to download the spreadsheet for use in this activity. Use the Regression function in the Data Analysis ToolPak.
Specify the data range for the response variable in 'Input Y Range" and the data range for the explanatory variable in "Input X
Range".
Jump to level 1
A researcher is analyzing the relationship between various variables in housing data for 32 cities: median list
prices of single family homes, condominium or co-ops, all homes, median household income, unemployment rate,
and population.
What is the correlation coefficient R for the model that predicts the list price of single family homes using
population as an explanatory variable?
R = Ex: 1.234
What is the interpretation of this correlation coefficient in context?
A Pick
moderate
strong
weak
correlation exists between the list price of single family homes and population.
1
Check
Next
Feedback?
Expert Solution
This question has been solved!
Explore an expertly crafted, step-by-step solution for a thorough understanding of key concepts.

This is a popular solution!

Trending now
This is a popular solution!

Step by step
Solved in 3 steps with 2 images

Knowledge Booster


Learn more about
Need a deep-dive on the concept behind this application? Look no further. Learn more about this topic, statistics and related others by exploring similar questions and additional content below.Recommended textbooks for you
Glencoe Algebra 1, Student Edition, 9780079039897…
Algebra
ISBN:
9780079039897
Author:
Carter
Publisher:
McGraw Hill

Algebra and Trigonometry (MindTap Course List)
Algebra
ISBN:
9781305071742
Author:
James Stewart, Lothar Redlin, Saleem Watson
Publisher:
Cengage Learning

Linear Algebra: A Modern Introduction
Algebra
ISBN:
9781285463247
Author:
David Poole
Publisher:
Cengage Learning
Glencoe Algebra 1, Student Edition, 9780079039897…
Algebra
ISBN:
9780079039897
Author:
Carter
Publisher:
McGraw Hill
Algebra and Trigonometry (MindTap Course List)
Algebra
ISBN:
9781305071742
Author:
James Stewart, Lothar Redlin, Saleem Watson
Publisher:
Cengage Learning
Linear Algebra: A Modern Introduction
Algebra
ISBN:
9781285463247
Author:
David Poole
Publisher:
Cengage Learning

Big Ideas Math A Bridge To Success Algebra 1: Stu…
Algebra
ISBN:
9781680331141
Author:
HOUGHTON MIFFLIN HARCOURT
Publisher:
Houghton Mifflin Harcourt

Functions and Change: A Modeling Approach to Coll…
Algebra
ISBN:
9781337111348
Author:
Bruce Crauder, Benny Evans, Alan Noell
Publisher:
Cengage Learning