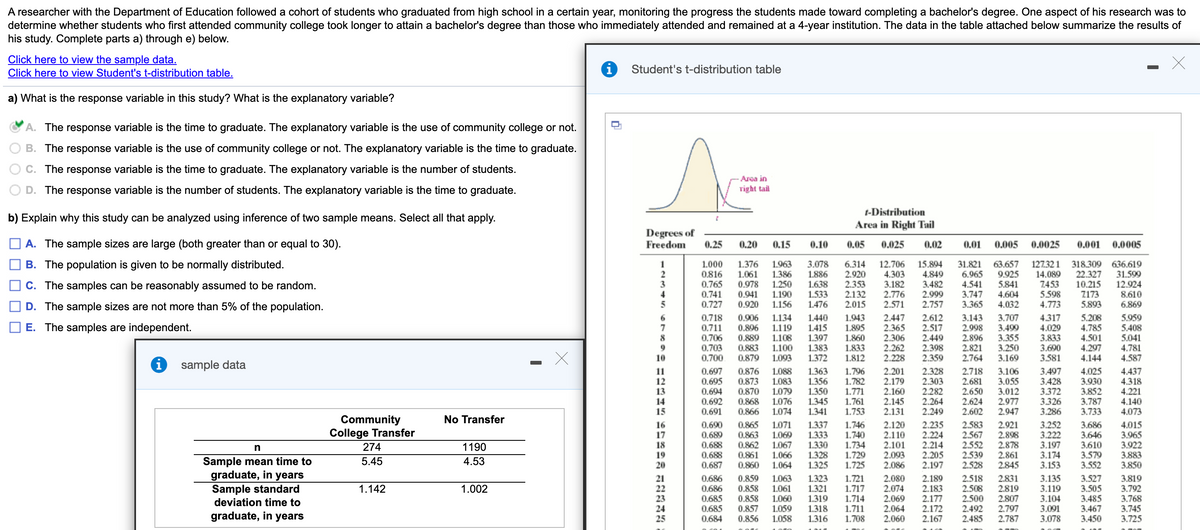
A researcher with the Department of Education followed a cohort of students who graduated from high school in a certain year, monitoring the progress the students made toward completing a bachelor's degree. One aspect of his research was to determine whether students who first attended community college took longer to attain a bachelor's degree than those who immediately attended and remained at a 4-year institution. The data in the table attached below summarize the results of nis study. Complete parts a) through e) below. Click here to view the sample data, Click here to view Student's t-distribution table. Student's t-distribution table a) What is the response variable in this study? What is the explanatory variable? & A. The response variable is the time to graduate. The explanatory variable is the use of community college or not. O B. The response variable is the use of community college or not. The explanatory variable is the time to graduate. OC. The response variable is the time to graduate. The explanatory variable is the number of students. O D. The response variable is the number of students. The explanatory variable is the time to graduate. Area in vight tail b) Explain why this study can be analyzed using inference of two sample means. Select all that apply. -Distribution Area in Right Tail Degrees of A. The sample sizes are large (both greater than or equal to 30). Freedom 0.25 0.20 0.15 0.10 0.05 0.025 0.02 0,01 0.005 0.0025 0.001 0.0005 O B. The population is given to be normally distributed. 12.706 15.894 4.303 3.182 2.776 2.571 31.821 63657 6.965 9.925 4.541 127.321 318.309 636.619 22.327 10.215 Z173 1.376 1.000 0816 0.765 0.741 0.727 1963 1.061 1386 1.250 1.190 1.156 3.078 1886 1638 1533 6.314 2.920 2.353 2.132 2.015 31.599 12.924 8610 6.869 4.849 O C. The samples can be reasonably assumed to be random. 14.089 2453 5.598 4.773 0.978 3482 2.999 2.757 5.841 0.941 0.920 3.747 3.365 4.604 OD. The sample sizes are not more than 5% of the population. 1476 4.032 5.893 1.134 L119 1.108 L100 1.943 1.895 1860 1.833 1812 0.718 0.711 0.706 0.703 0.700 0.906 0,806 0.889 0.883 0879 1440 1415 1.397 1383 1372 2447 2.365 2.612 2.517 2.449 2.398 2.359 3.143 2.998 3.707 3.499 3.355 4317 4.029 3.833 3.690 3.581 5.208 4.785 4.501 5.959 5.408 5.041 4.781 4.587 DE. The samples are independent. 2.306 2.262 2.228 2.896 2.821 2.764 3.250 3.169 4.297 4.144 10 1093 O sample data 0 607 0.697 0.695 0.694 0,692 0.691 0,690 0.689 0.876 LO88 LO83 1079 1076 1074 1.363 1.356 1.350 1345 1341 1.796 1.782 1.771 1.761 1.753 2.201 2.179 2.160 2.145 2.131 2.328 2.303 2.282 2.264 2.249 2.718 2.681 2.650 2624 2.602 3.106 3.055 3.012 2.977 2.947 3497 3428 3372 3.326 3.286 4.025 3.930 3.852 3.787 3.733 4.437 4318 4.221 4.140 4.073 0873 0870 12 13 14 15 0.866 Community College Transfer 274 No Transfer 16 17 18 19 0.865 0863 062 0.861 L071 1.069 L067 1337 1333 1330 1.746 1.740 1.734 1.729 1.725 2.120 2.110 2.101 2.093 2.086 2.235 2.224 2.214 2.205 2.197 2.583 2.567 2552 2.539 2.528 2.921 2.898 2.878 2.861 2845 3.252 3.222 3.197 3.174 3.153 3.686 0.688 0.688 0.687 3.646 3.610 3.579 3.552 4.015 3.965 3.922 3.883 3850 1190 1066 1.064 1.328 1325 Sample mean time to graduate, in years Sample standard deviation time to graduate in voare 5.45 4.53 20 0.860 21 22 23 24 0.686 0,686 0.685 0685 0.859 0.858 0.858 0857 1063 1061 1060 1.059 1.323 1321 1319 1318 1.721 1.717 1.714 1.711 2.080 2.074 2.069 2.064 2.189 2.183 2.177 2.172 2518 2.508 2.500 2.492 2831 2819 2807 2.797 3.135 3.119 3.104 3.091 3.527 3.505 3.485 3.467 3.819 3.792 3.768 3.745 1.142 1.002


Inverse Normal Distribution
The method used for finding the corresponding z-critical value in a normal distribution using the known probability is said to be an inverse normal distribution. The inverse normal distribution is a continuous probability distribution with a family of two parameters.
Mean, Median, Mode
It is a descriptive summary of a data set. It can be defined by using some of the measures. The central tendencies do not provide information regarding individual data from the dataset. However, they give a summary of the data set. The central tendency or measure of central tendency is a central or typical value for a probability distribution.
Z-Scores
A z-score is a unit of measurement used in statistics to describe the position of a raw score in terms of its distance from the mean, measured with reference to standard deviation from the mean. Z-scores are useful in statistics because they allow comparison between two scores that belong to different normal distributions.

Step by step
Solved in 2 steps


