A rocket will carry a communications satellite into low Earth orbit. Suppose that the thrust during the first 200 sec of fligh is provided by solid rocket boosters at different points during liftoff. The graph shows the acceleration in G-forces (that is acceleration in 9.8-m/sec2 increments) versus time after launch. a. Approximate the interval(s) over which the acceleration is increasing. b. Approximate the interval(s) over which the acceleration is decreasing. c. How many turning points does the graph show? d. Based on the number of turning points, what is the minimum degree of a polynomial function that could be used to model acceleration versus time? Would the leading coefficient be positive or negative? e. Approximate the time when the acceleration was the greatest. f. Approximate the value of the maximum acceleration. Acceleration in G-Forces vs. Time after Liftoff {(184, 2.85), 2.5 2H(12, 1.36)| 1.5 0.5 |(68,0.97)| 40 80 120 160 200 Elapsed Time (sec) Acceleration (G-Forces)
A rocket will carry a communications satellite into low Earth orbit. Suppose that the thrust during the first 200 sec of fligh is provided by solid rocket boosters at different points during liftoff. The graph shows the acceleration in G-forces (that is acceleration in 9.8-m/sec2 increments) versus time after launch. a. Approximate the interval(s) over which the acceleration is increasing. b. Approximate the interval(s) over which the acceleration is decreasing. c. How many turning points does the graph show? d. Based on the number of turning points, what is the minimum degree of a polynomial function that could be used to model acceleration versus time? Would the leading coefficient be positive or negative? e. Approximate the time when the acceleration was the greatest. f. Approximate the value of the maximum acceleration. Acceleration in G-Forces vs. Time after Liftoff {(184, 2.85), 2.5 2H(12, 1.36)| 1.5 0.5 |(68,0.97)| 40 80 120 160 200 Elapsed Time (sec) Acceleration (G-Forces)

Trigonometry (MindTap Course List)
10th Edition
ISBN:9781337278461
Author:Ron Larson
Publisher:Ron Larson
Chapter6: Topics In Analytic Geometry
Section: Chapter Questions
Problem 33CT

Related questions
Question
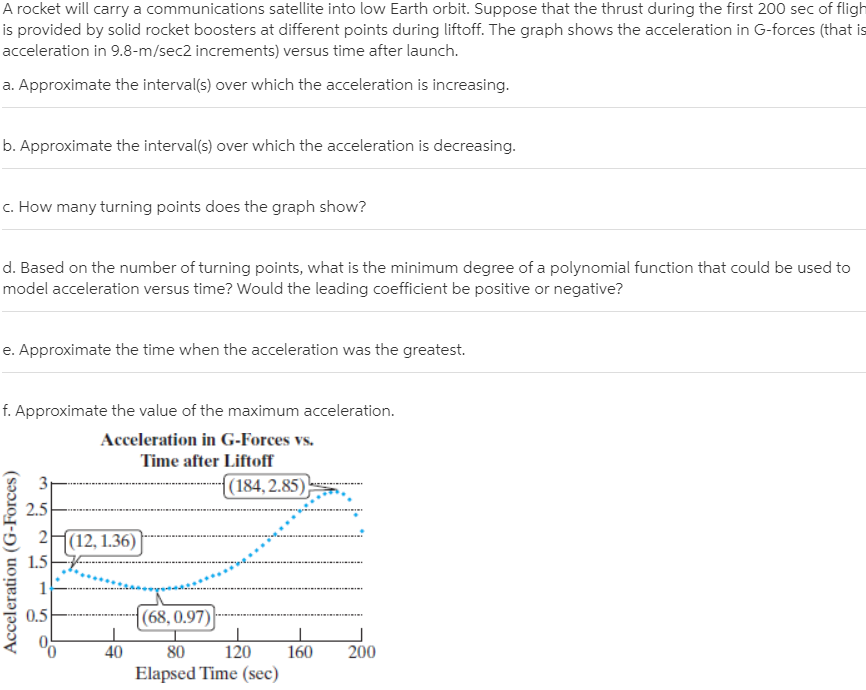
Transcribed Image Text:A rocket will carry a communications satellite into low Earth orbit. Suppose that the thrust during the first 200 sec of fligh
is provided by solid rocket boosters at different points during liftoff. The graph shows the acceleration in G-forces (that is
acceleration in 9.8-m/sec2 increments) versus time after launch.
a. Approximate the interval(s) over which the acceleration is increasing.
b. Approximate the interval(s) over which the acceleration is decreasing.
c. How many turning points does the graph show?
d. Based on the number of turning points, what is the minimum degree of a polynomial function that could be used to
model acceleration versus time? Would the leading coefficient be positive or negative?
e. Approximate the time when the acceleration was the greatest.
f. Approximate the value of the maximum acceleration.
Acceleration in G-Forces vs.
Time after Liftoff
{(184, 2.85),
2.5
2H(12, 1.36)|
1.5
0.5
|(68,0.97)|
40
80
120
160
200
Elapsed Time (sec)
Acceleration (G-Forces)
Expert Solution
This question has been solved!
Explore an expertly crafted, step-by-step solution for a thorough understanding of key concepts.

This is a popular solution!

Trending now
This is a popular solution!

Step by step
Solved in 3 steps with 3 images

Recommended textbooks for you
Trigonometry (MindTap Course List)
Trigonometry
ISBN:
9781337278461
Author:
Ron Larson
Publisher:
Cengage Learning


Linear Algebra: A Modern Introduction
Algebra
ISBN:
9781285463247
Author:
David Poole
Publisher:
Cengage Learning
Trigonometry (MindTap Course List)
Trigonometry
ISBN:
9781337278461
Author:
Ron Larson
Publisher:
Cengage Learning
Linear Algebra: A Modern Introduction
Algebra
ISBN:
9781285463247
Author:
David Poole
Publisher:
Cengage Learning

Functions and Change: A Modeling Approach to Coll…
Algebra
ISBN:
9781337111348
Author:
Bruce Crauder, Benny Evans, Alan Noell
Publisher:
Cengage Learning