A sample data set has a mean of 57 and a standard de- viation of 11. Determine whether each of the following sample measurements is an outlier. a. 65 b. 21 с. 72 d. 98
A sample data set has a mean of 57 and a standard de- viation of 11. Determine whether each of the following sample measurements is an outlier. a. 65 b. 21 с. 72 d. 98

Glencoe Algebra 1, Student Edition, 9780079039897, 0079039898, 2018
18th Edition
ISBN:9780079039897
Author:Carter
Publisher:Carter
Chapter10: Statistics
Section10.5: Comparing Sets Of Data
Problem 14PPS

Related questions
Question
Plz help me to solve
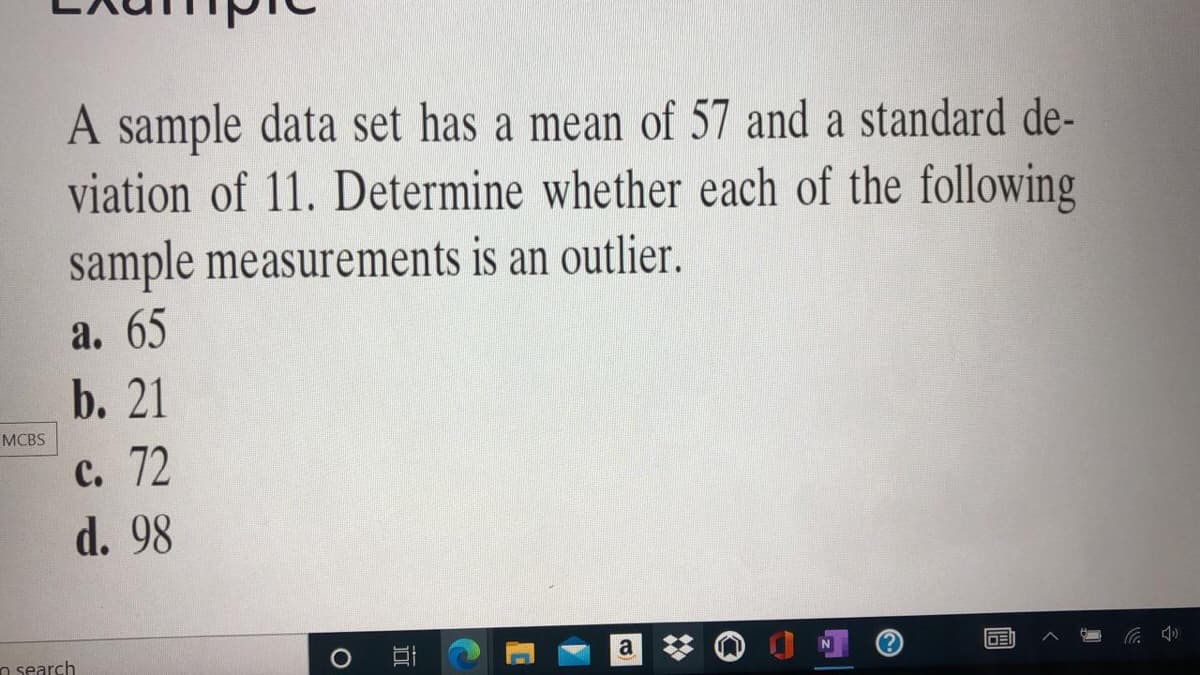
Transcribed Image Text:A sample data set has a mean of 57 and a standard de-
viation of 11. Determine whether each of the following
sample measurements is an outlier.
a. 65
b. 21
MCBS
с. 72
d. 98
o search
a
DE
Expert Solution
This question has been solved!
Explore an expertly crafted, step-by-step solution for a thorough understanding of key concepts.

This is a popular solution!

Trending now
This is a popular solution!

Step by step
Solved in 2 steps

Recommended textbooks for you
Glencoe Algebra 1, Student Edition, 9780079039897…
Algebra
ISBN:
9780079039897
Author:
Carter
Publisher:
McGraw Hill
Glencoe Algebra 1, Student Edition, 9780079039897…
Algebra
ISBN:
9780079039897
Author:
Carter
Publisher:
McGraw Hill