A sample of 15 small bags of the same brand of candies was selected. Assume that the population distribution of bag weights is normal. The weight of each bag was then recorded. The mean weight was 2 ounces with a standard deviation of 0.12 ounces. The population standard deviation is known to be 0.1 ounce. NOTE: If you are using a Student's t-distribution, you may assume that the underlying population is normally distributed. (In general, you must first prove that assumption, though.)
A sample of 15 small bags of the same brand of candies was selected. Assume that the population distribution of bag weights is normal. The weight of each bag was then recorded. The mean weight was 2 ounces with a standard deviation of 0.12 ounces. The population standard deviation is known to be 0.1 ounce. NOTE: If you are using a Student's t-distribution, you may assume that the underlying population is normally distributed. (In general, you must first prove that assumption, though.)

Glencoe Algebra 1, Student Edition, 9780079039897, 0079039898, 2018
18th Edition
ISBN:9780079039897
Author:Carter
Publisher:Carter
Chapter10: Statistics
Section10.4: Distributions Of Data
Problem 19PFA

Related questions

Question

Transcribed Image Text:A sample of 15 small bags of the same brand of candies was selected. Assume that the population distribution of bag weights is normal. The weight of each bag was then recorded. The mean
weight was 2 ounces with a standard deviation of 0.12 ounces. The population standard deviation is known to be 0.1 ounce.
NOTE: If you are using a Student's t-distribution, you may assume that the underlying population is normally distributed. (In general, you must first prove that assumption, though.)
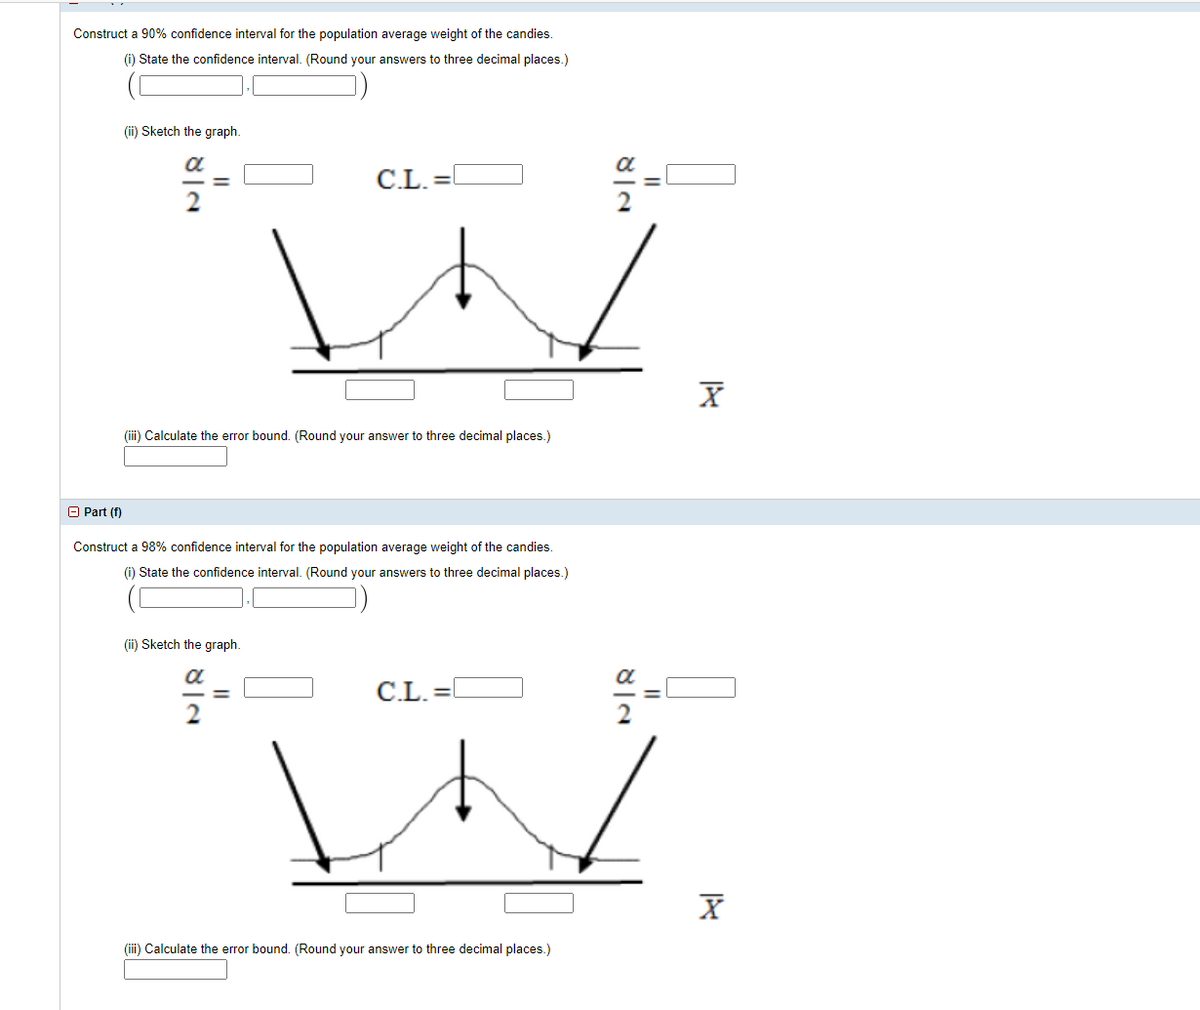
Transcribed Image Text:Construct a 90% confidence interval for the population average weight of the candies.
(i) State the confidence interval. (Round your answers to three decimal places.)
(ii) Sketch the graph.
a
a
C.L. =
(iii) Calculate the error bound. (Round your answer to three decimal places.)
O Part (f)
Construct a 98% confidence interval for the population average weight of the candies.
(i) State the confidence interval. (Round your answers to three decimal places.)
(ii) Sketch the graph.
C.L. =0
(i) Calculate the error bound. (Round your answer to three decimal places.)
Expert Solution
This question has been solved!
Explore an expertly crafted, step-by-step solution for a thorough understanding of key concepts.

This is a popular solution!

Trending now
This is a popular solution!

Step by step
Solved in 3 steps

Knowledge Booster


Learn more about
Need a deep-dive on the concept behind this application? Look no further. Learn more about this topic, statistics and related others by exploring similar questions and additional content below.Recommended textbooks for you
Glencoe Algebra 1, Student Edition, 9780079039897…
Algebra
ISBN:
9780079039897
Author:
Carter
Publisher:
McGraw Hill
Glencoe Algebra 1, Student Edition, 9780079039897…
Algebra
ISBN:
9780079039897
Author:
Carter
Publisher:
McGraw Hill