MATLAB: An Introduction with Applications
6th Edition
ISBN: 9781119256830
Author: Amos Gilat
Publisher: John Wiley & Sons Inc
expand_more
expand_more
format_list_bulleted
Topic Video
Question

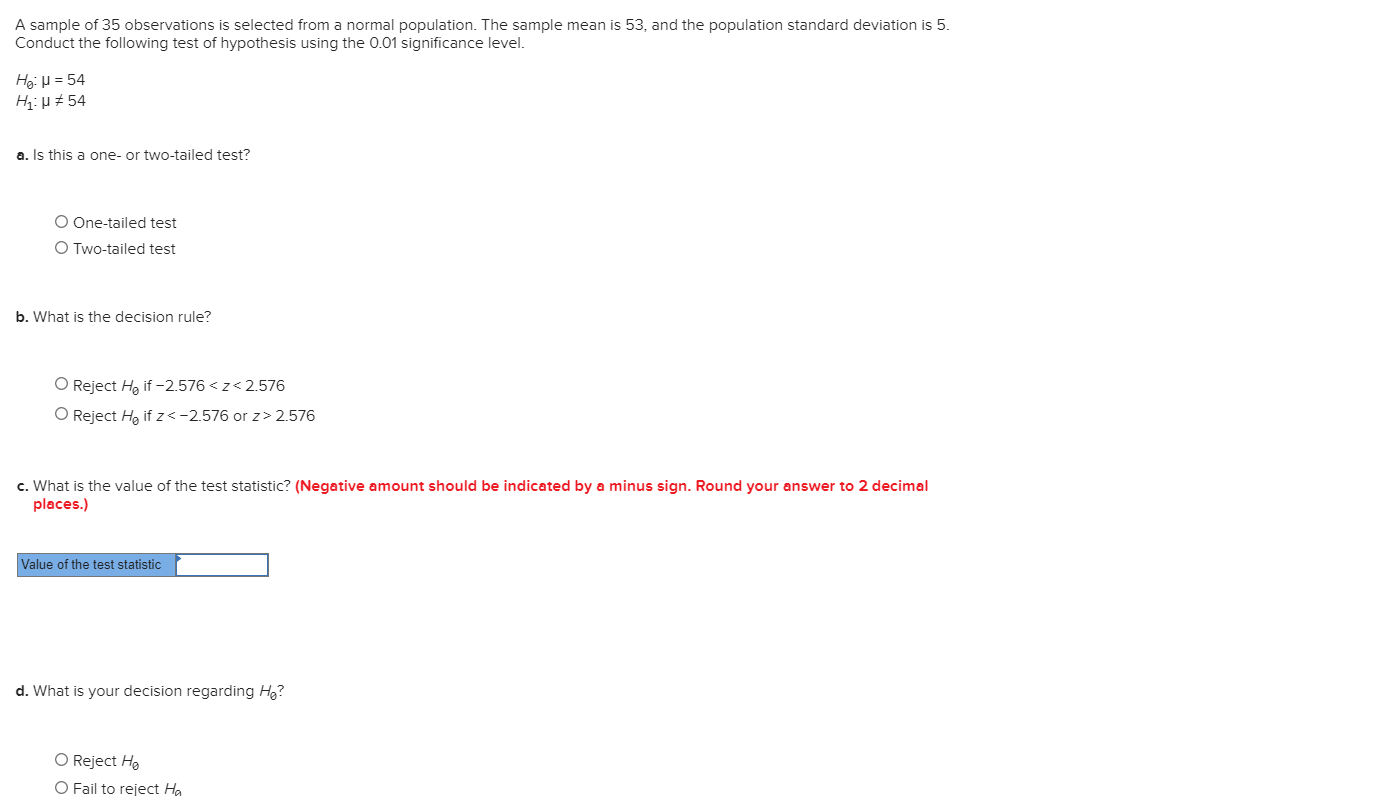
Transcribed Image Text:A sample of 35 observations is selected from a normal population. The sample mean is 53, and the population standard deviation is 5.
Conduct the following test of hypothesis using the 0.01 significance level.
Họ: H = 54
H: µ # 54
a. Is this a one- or two-tailed test?
O One-tailed test
O Two-tailed test
b. What is the decision rule?
O Reject H, if -2.576 < z< 2.576
O Reject H, if z<-2.576 or z> 2.576
c. What is the value of the test statistic? (Negative amount should be indicated by a minus sign. Round your answer to 2 decimal
places.)
Value of the test statistic

Expert Solution

This question has been solved!
Explore an expertly crafted, step-by-step solution for a thorough understanding of key concepts.
This is a popular solution
Trending nowThis is a popular solution!
Step by stepSolved in 3 steps with 5 images

Knowledge Booster
Learn more about
Need a deep-dive on the concept behind this application? Look no further. Learn more about this topic, statistics and related others by exploring similar questions and additional content below.Similar questions
- A population mean is 13. The sample mean is 12.8, and the sample standard deviation is 2. The sample size is 20. What standard error would you use to conduct a hypothesis test on the mean?arrow_forwardA company manufactures electrical components and today they are producing 220-ohm carbon film resistors. A sample of 8 resistors was taken from the production line and were tested. Below are the measured resistance of the 8 resistors. [220.8, 221.9, 223.2, 219.1, 222.8, 219.2, 219.4, 219.5] Consider the two-sided hypothesis test for the mean resistance: Ho : µ = 220 vs Hj : µ # 220 Calculate the test statistic for the observed data for this hypothesis test. Give your answer to 3 decimal places. Test statistic: to 3 d.p. What is your hypothesis decision given that the manufacturing company is happy with a 5% significance level of the test? Hypothesis Decision: (No answer given) You may use the following quantile values from the Student-t distribution: df 7 8 pt(0.900, df) 1.415 1.397 1.383 pt(0.950, df) 1.895 1.860 1.833 pt(0.975, df) 2.365 2.306 2.262arrow_forwardplease answer a, b, carrow_forward
- A sample mean, sample size, and sample standard deviation are provided below. Use the one-mean t-test to perform the required hypothesis test at the 10% significance level. x=25, s=10, n=24, H0: μ=24, Ha: μ>24 The test statistic is t= (round to two decimals as needed)arrow_forwardUse the following scenario to answer the next 6 questions. An engineer has designed a valve that will regulate water pressure on an automobile engine. The valve was tested on 30 engines and the mean pressure was 4.8 psi with a standard deviation of 1 psi. If the valve was designed to produce an overall mean pressure of 5.0 psi, is there sufficient evidence at the 10% level of significance that the valve performs below specifications? The appropriate hypothesis test for this scenario is: Group of answer choices right-tailed two-tailed left-tailedarrow_forwardA study was done on body temperatures of men and women. The results are shown in the table. Assume that the two samples are independent simple random samples selected from normally distributed populations, and do not assume that the population standard deviations are equal. Complete parts (a) and (b) below. Use a 0.01 significance level for both parts. a. Test the claim that the two samples are from populations with the same mean. What are the null and alternative hypotheses? What is the test statistic, t? What is the P-value? State the conclusion for the test. b. Construct a confidence interval suitable for testing the claim that the two samples are from populations with the same mean.arrow_forward
- . nonzerorands expects 3 arguments The average American consumes 100 liters of alcohol per year. Does the average college student consume a different amount of alcohol per year? A researcher surveyed 15 randomly selected college students and found that they averaged 86 liters of alcohol consumed per year with a standard deviation of 16 liters. What can be concluded at the the a = 0.05 level of significance? a. For this study, we should use t-test for a population mean b. The null and alternative hypotheses would be: Ho: μν H₁: 100 100 E -3.389 (please show your answer to 3 decimal places.) (Please show your answer to 4 decimal places.) c. The test statistic t d. The p-value = e. The p-value is > ✓ a f. Based on this, we should fail to reject g. Thus, the final conclusion is that ... the null hypothesis. O The data suggest the populaton mean is significantly different from 100 at a = 0.05, so there is statistically significant evidence to conclude that the population mean amount of…arrow_forwardplease answer d, e, farrow_forwardA study was done on body temperatures of men and women. The results are shown in the table. Assume that the two samples are independent simple random samples selected from normally distributed populations, and do not assume that the population standard deviations are equal. State the conclusion for the test. Use a 0.01 significance level to test the claim that men have a higher mean body temperature than women. μ n X S Men 11 11 97.53°F 0.76°F Women H₂ 59 97.46°F 0.69°F O A. Reject the null hypothesis. There is not sufficient evidence to support the claim that men have a higher mean body temperature than women. OB. Fail to reject the null hypothesis. There is sufficient evidence to support the claim that men have a higher mean body temperature than women. OC. Fail to reject the null hypothesis. There is not sufficient evidence to support the claim that men have a higher mean body temperature than women. OD. Reject the null hypothesis. There is sufficient evidence to support the claim…arrow_forward
- A study was done on body temperatures of men and women. The results are shown in the table. Assume that the two samples are independent simple random samples selected from normally distributed populations, and do not assume that the population standard deviations are equal. Complete parts (a) and (b) below. a. Use a 0.01 significance level to test the claim that men have a higher mean body temperature than women. What are the null and alternative hypotheses? A. Ho: M₁ = ₂ H₁: H₁ H₂ C. Ho: M₁ = H2 H₁: H₁ H₂ The test statistic, t, is (Round to two decimal places as needed.) B. Ho: H₁ H₂ H₁ H₁arrow_forwardA study was done on body temperatures of men and women. The results are shown in the table. Assume that the two samples are independent simple random samples selected from normally distributed populations, and do not assume that the population standard deviations are equal. State the conclusion for the test. Use a 0.01 significance level to test the claim that men have a higher mean body temperature than women. μ n X S Men H₁ 11 97.66°F 0.75°F Women H₂ 59 97.22°F 0.68°F O A. Reject the null hypothesis. There is not sufficient evidence to support the claim that men have a higher mean body temperature than women. O B. Fail to reject the null hypothesis. There is not sufficient evidence to support the claim that men have a higher mean body temperature than women. O C. Reject the null hypothesis. There is sufficient evidence to support the claim that men have a higher mean body temperature than women. O D. Fail to reject the null hypothesis. There is sufficient evidence to support the…arrow_forwardhypothesis testing is the topicarrow_forwardarrow_back_iosSEE MORE QUESTIONSarrow_forward_ios
Recommended textbooks for you
- MATLAB: An Introduction with ApplicationsStatisticsISBN:9781119256830Author:Amos GilatPublisher:John Wiley & Sons IncProbability and Statistics for Engineering and th...StatisticsISBN:9781305251809Author:Jay L. DevorePublisher:Cengage LearningStatistics for The Behavioral Sciences (MindTap C...StatisticsISBN:9781305504912Author:Frederick J Gravetter, Larry B. WallnauPublisher:Cengage Learning
- Elementary Statistics: Picturing the World (7th E...StatisticsISBN:9780134683416Author:Ron Larson, Betsy FarberPublisher:PEARSONThe Basic Practice of StatisticsStatisticsISBN:9781319042578Author:David S. Moore, William I. Notz, Michael A. FlignerPublisher:W. H. FreemanIntroduction to the Practice of StatisticsStatisticsISBN:9781319013387Author:David S. Moore, George P. McCabe, Bruce A. CraigPublisher:W. H. Freeman

MATLAB: An Introduction with Applications
Statistics
ISBN:9781119256830
Author:Amos Gilat
Publisher:John Wiley & Sons Inc

Probability and Statistics for Engineering and th...
Statistics
ISBN:9781305251809
Author:Jay L. Devore
Publisher:Cengage Learning

Statistics for The Behavioral Sciences (MindTap C...
Statistics
ISBN:9781305504912
Author:Frederick J Gravetter, Larry B. Wallnau
Publisher:Cengage Learning

Elementary Statistics: Picturing the World (7th E...
Statistics
ISBN:9780134683416
Author:Ron Larson, Betsy Farber
Publisher:PEARSON

The Basic Practice of Statistics
Statistics
ISBN:9781319042578
Author:David S. Moore, William I. Notz, Michael A. Fligner
Publisher:W. H. Freeman

Introduction to the Practice of Statistics
Statistics
ISBN:9781319013387
Author:David S. Moore, George P. McCabe, Bruce A. Craig
Publisher:W. H. Freeman