A sample of human brain volumes (cm3) is given below. Use the given data values to identify the corresponding z scores that are used for a normal quantile plot, then identify the coordinates of each point in the normal quantile plot. Construct the normal quantile plot, then determine whether the data appear to be from a population with a normal distribution 1051 1415 1078 1072 959 1072 1069 1044 List the z scores for the normal quantile plot. (Round to two decimal places as needed. Use ascending order.)
A sample of human brain volumes (cm3) is given below. Use the given data values to identify the corresponding z scores that are used for a normal quantile plot, then identify the coordinates of each point in the normal quantile plot. Construct the normal quantile plot, then determine whether the data appear to be from a population with a normal distribution 1051 1415 1078 1072 959 1072 1069 1044 List the z scores for the normal quantile plot. (Round to two decimal places as needed. Use ascending order.)

Glencoe Algebra 1, Student Edition, 9780079039897, 0079039898, 2018
18th Edition
ISBN:9780079039897
Author:Carter
Publisher:Carter
Chapter10: Statistics
Section10.4: Distributions Of Data
Problem 19PFA

Related questions
Question
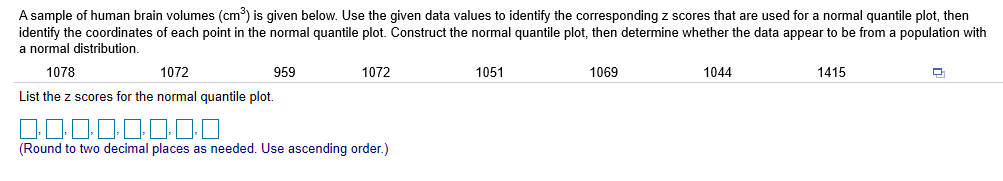
Transcribed Image Text:A sample of human brain volumes (cm3) is given below. Use the given data values to identify the corresponding z scores that are used for a normal quantile plot, then
identify the coordinates of each point in the normal quantile plot. Construct the normal quantile plot, then determine whether the data appear to be from a population with
a normal distribution
1051
1415
1078
1072
959
1072
1069
1044
List the z scores for the normal quantile plot.
(Round to two decimal places as needed. Use ascending order.)
Expert Solution
This question has been solved!
Explore an expertly crafted, step-by-step solution for a thorough understanding of key concepts.

This is a popular solution!

Trending now
This is a popular solution!

Step by step
Solved in 6 steps with 4 images

Recommended textbooks for you
Glencoe Algebra 1, Student Edition, 9780079039897…
Algebra
ISBN:
9780079039897
Author:
Carter
Publisher:
McGraw Hill
Glencoe Algebra 1, Student Edition, 9780079039897…
Algebra
ISBN:
9780079039897
Author:
Carter
Publisher:
McGraw Hill