A sociologist randomly selects single adults for different groups of three, and the random variable x is the number in the group who say that the most fun way to flirt is in person. Determine whether a probability distribution is given. If a probability distribution is given, find its mean and standard deviation. If a probability distribution is not given, identify the requirements that are not satisfied. P(x) 0.091 0.335 0.417 1 2 0.157 Does the table show a probability distribution? Select all that apply. O A. Yes, the table shows a probability distribution. | B. No, not every probability is between 0 and 1 inclusive. | C. No, the sum of all the probabilities is not equal to 1. | D. No, the random variable x is categorical instead of numerical. | E. No, the random variable x's number values are not associated with probabilities. Find the mean of the random variable x. Select the correct choice below and, if necessary, fill in the answer box to complete your choice. O A. µ= adult(s) (Round to one decimal place as needed.) O B. The table does not show a probability distribution. Find the standard deviation of the random variable x. Select the correct choice below and, if necessary, fill in the answer box to complete your choice. OA. | adult(s) (Round to one decimal place as needed.) O O O
A sociologist randomly selects single adults for different groups of three, and the random variable x is the number in the group who say that the most fun way to flirt is in person. Determine whether a probability distribution is given. If a probability distribution is given, find its mean and standard deviation. If a probability distribution is not given, identify the requirements that are not satisfied. P(x) 0.091 0.335 0.417 1 2 0.157 Does the table show a probability distribution? Select all that apply. O A. Yes, the table shows a probability distribution. | B. No, not every probability is between 0 and 1 inclusive. | C. No, the sum of all the probabilities is not equal to 1. | D. No, the random variable x is categorical instead of numerical. | E. No, the random variable x's number values are not associated with probabilities. Find the mean of the random variable x. Select the correct choice below and, if necessary, fill in the answer box to complete your choice. O A. µ= adult(s) (Round to one decimal place as needed.) O B. The table does not show a probability distribution. Find the standard deviation of the random variable x. Select the correct choice below and, if necessary, fill in the answer box to complete your choice. OA. | adult(s) (Round to one decimal place as needed.) O O O

MATLAB: An Introduction with Applications
6th Edition
ISBN:9781119256830
Author:Amos Gilat
Publisher:Amos Gilat
Chapter1: Starting With Matlab
Section: Chapter Questions
Problem 1P

Related questions

Concept explainers
Contingency Table
A contingency table can be defined as the visual representation of the relationship between two or more categorical variables that can be evaluated and registered. It is a categorical version of the scatterplot, which is used to investigate the linear relationship between two variables. A contingency table is indeed a type of frequency distribution table that displays two variables at the same time.
Binomial Distribution
Binomial is an algebraic expression of the sum or the difference of two terms. Before knowing about binomial distribution, we must know about the binomial theorem.
Topic Video
Question
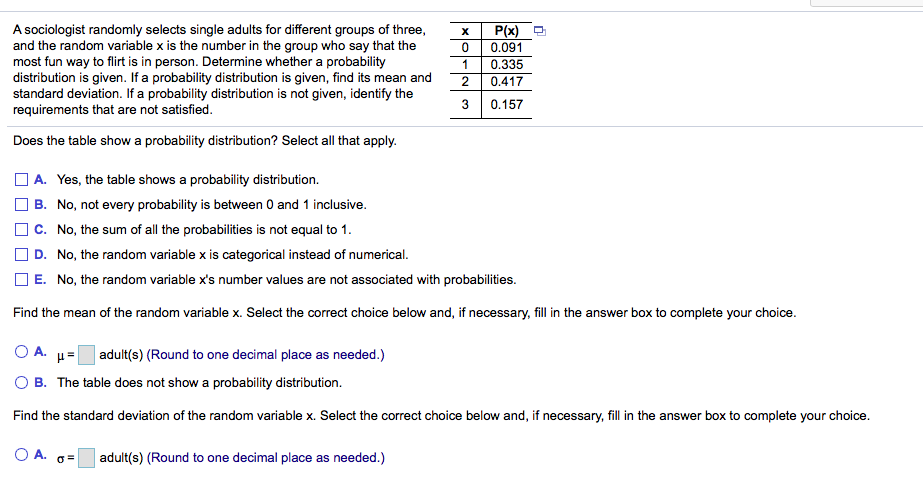
Transcribed Image Text:A sociologist randomly selects single adults for different groups of three,
and the random variable x is the number in the group who say that the
most fun way to flirt is in person. Determine whether a probability
distribution is given. If a probability distribution is given, find its mean and
standard deviation. If a probability distribution is not given, identify the
requirements that are not satisfied.
P(x)
0.091
0.335
0.417
1
2
0.157
Does the table show a probability distribution? Select all that apply.
O A. Yes, the table shows a probability distribution.
| B. No, not every probability is between 0 and 1 inclusive.
| C. No, the sum of all the probabilities is not equal to 1.
| D. No, the random variable x is categorical instead of numerical.
| E. No, the random variable x's number values are not associated with probabilities.
Find the mean of the random variable x. Select the correct choice below and, if necessary, fill in the answer box to complete your choice.
O A. µ= adult(s) (Round to one decimal place as needed.)
O B. The table does not show a probability distribution.
Find the standard deviation of the random variable x. Select the correct choice below and, if necessary, fill in the answer box to complete your choice.
OA.
| adult(s) (Round to one decimal place as needed.)
O O O
Expert Solution
This question has been solved!
Explore an expertly crafted, step-by-step solution for a thorough understanding of key concepts.

This is a popular solution!

Trending now
This is a popular solution!

Step by step
Solved in 3 steps with 2 images

Knowledge Booster


Learn more about
Need a deep-dive on the concept behind this application? Look no further. Learn more about this topic, statistics and related others by exploring similar questions and additional content below.Recommended textbooks for you
MATLAB: An Introduction with Applications
Statistics
ISBN:
9781119256830
Author:
Amos Gilat
Publisher:
John Wiley & Sons Inc

Probability and Statistics for Engineering and th…
Statistics
ISBN:
9781305251809
Author:
Jay L. Devore
Publisher:
Cengage Learning

Statistics for The Behavioral Sciences (MindTap C…
Statistics
ISBN:
9781305504912
Author:
Frederick J Gravetter, Larry B. Wallnau
Publisher:
Cengage Learning
MATLAB: An Introduction with Applications
Statistics
ISBN:
9781119256830
Author:
Amos Gilat
Publisher:
John Wiley & Sons Inc
Probability and Statistics for Engineering and th…
Statistics
ISBN:
9781305251809
Author:
Jay L. Devore
Publisher:
Cengage Learning
Statistics for The Behavioral Sciences (MindTap C…
Statistics
ISBN:
9781305504912
Author:
Frederick J Gravetter, Larry B. Wallnau
Publisher:
Cengage Learning

Elementary Statistics: Picturing the World (7th E…
Statistics
ISBN:
9780134683416
Author:
Ron Larson, Betsy Farber
Publisher:
PEARSON

The Basic Practice of Statistics
Statistics
ISBN:
9781319042578
Author:
David S. Moore, William I. Notz, Michael A. Fligner
Publisher:
W. H. Freeman

Introduction to the Practice of Statistics
Statistics
ISBN:
9781319013387
Author:
David S. Moore, George P. McCabe, Bruce A. Craig
Publisher:
W. H. Freeman