(a) State the null hypothesis H, and the alternative hypothesis H. H :0 H:0 (b) Determine the type of test statistic to use. (Choose one) (c) Find the value of the test statistic. (Round to three or more decimal places.) (d) Find the p-value. (Round to three or more decimal places.) (e) Based on the data, can we conclude (using the 0.05 level) that there is a significant linear relationship between the cost of the advertising campaign and the resulting percentage increase in sales? Yes No
(a) State the null hypothesis H, and the alternative hypothesis H. H :0 H:0 (b) Determine the type of test statistic to use. (Choose one) (c) Find the value of the test statistic. (Round to three or more decimal places.) (d) Find the p-value. (Round to three or more decimal places.) (e) Based on the data, can we conclude (using the 0.05 level) that there is a significant linear relationship between the cost of the advertising campaign and the resulting percentage increase in sales? Yes No

Glencoe Algebra 1, Student Edition, 9780079039897, 0079039898, 2018
18th Edition
ISBN:9780079039897
Author:Carter
Publisher:Carter
Chapter4: Equations Of Linear Functions
Section4.5: Correlation And Causation
Problem 15PPS

Related questions
Question
Transcribed Image Text:Español
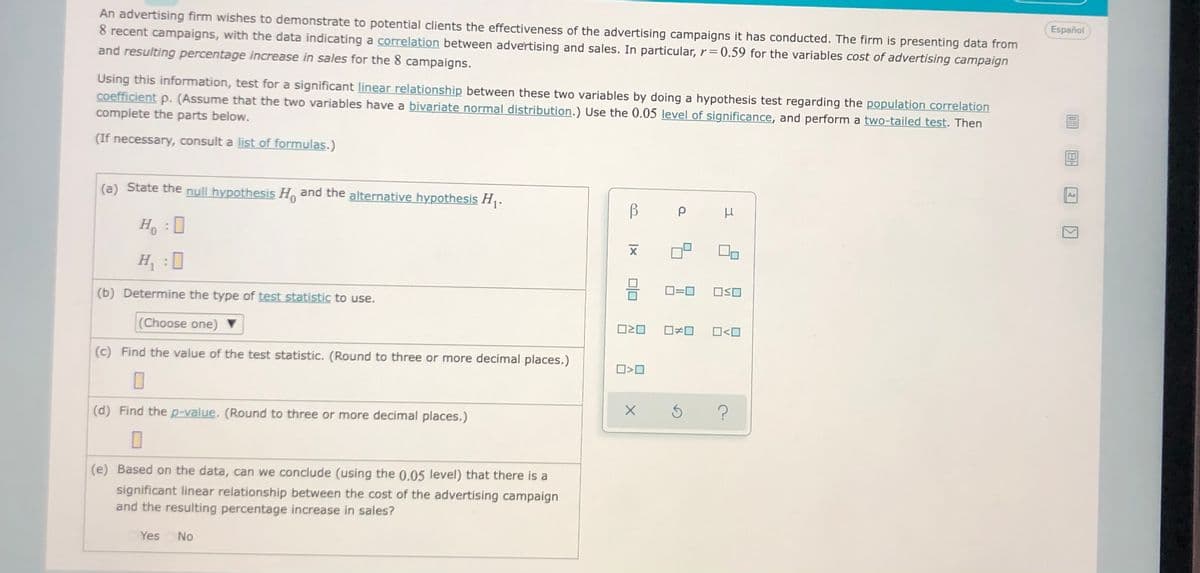
An advertising firm wishes to demonstrate to potential clients the effectiveness of the advertising campaigns it has conducted. The firm is presenting data from
8 recent campaigns, with the data indicating a correlation between advertising and sales. In particular, r= 0.59 for the variables cost of advertising campaign
and resulting percentage increase in sales for the 8 campaigns.
Using this information, test for a significant linear relationship between these two variables by doing a hypothesis test regarding the population correlation
coefficient p. (Assume that the two variables have a bivariate normal distribution.) Use the 0.05 level of significance, and perform a two-tailed test. Then
complete the parts below.
(If necessary, consult a list of formulas.)
Aa
(a) State the null hypothesis H and the alternative hypothesis H .
Ho :0
H :0
D=0
OSO
(b) Determine the type of test statistic to use.
Choose one) ▼
O<O
(c) Find the value of the test statistic. (Round to three or more decimal places.)
(d) Find the p-value. (Round to three or more decimal places.)
(e) Based on the data, can we conclude (using the 0.05 level) that there is a
significant linear relationship between the cost of the advertising campaign
and the resulting percentage increase in sales?
Yes
No
Expert Solution
This question has been solved!
Explore an expertly crafted, step-by-step solution for a thorough understanding of key concepts.

Step by step
Solved in 2 steps with 2 images

Recommended textbooks for you
Glencoe Algebra 1, Student Edition, 9780079039897…
Algebra
ISBN:
9780079039897
Author:
Carter
Publisher:
McGraw Hill

Big Ideas Math A Bridge To Success Algebra 1: Stu…
Algebra
ISBN:
9781680331141
Author:
HOUGHTON MIFFLIN HARCOURT
Publisher:
Houghton Mifflin Harcourt
Glencoe Algebra 1, Student Edition, 9780079039897…
Algebra
ISBN:
9780079039897
Author:
Carter
Publisher:
McGraw Hill
Big Ideas Math A Bridge To Success Algebra 1: Stu…
Algebra
ISBN:
9781680331141
Author:
HOUGHTON MIFFLIN HARCOURT
Publisher:
Houghton Mifflin Harcourt