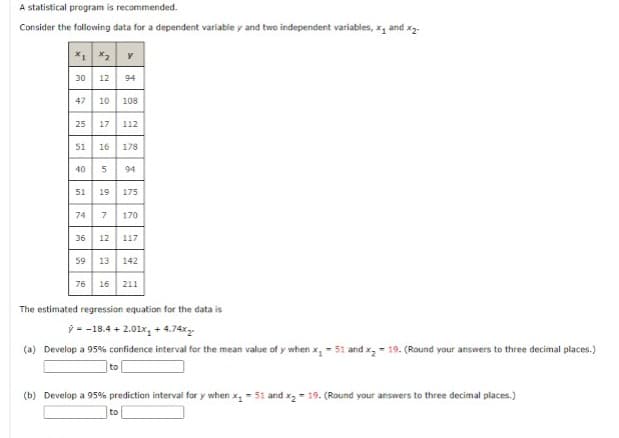
A statistical program is recommended. Consider the following data for a dependent variable y and two independent variables, x, and x2. 30 12 94 47 10 108 25 17 112 51 16 178 40 5 94 51 19 175 74 7 170 36 12 11 7 59 13 142 76 16 211 The estimated regression equation for the data is i --18.4 + 2.01x, + 4.74x2- (a) Develop a 95% confidence interval for the mean value of y when x, - 51 and x, = 19. (Round your answers to three decimal places.) to (b) Develop a 95% prediction interval for y when x - 51 and x, - 19. (Round your answers to three decimal places.) to


Q: Use the following ANOVA table for regression to answer the questions. Analysis of Variance Source…
A: ANOVA is a statistical method used to compare the null hypothesis and alternative hypothesis using F…
Q: b. Calculate the p-value. a. What is the alternative hypothesis? A. HA: μ1−μ2≥0 B. HA:…
A: From provided information, claimed that mean for first sample is greater than mean for second…
Q: Čalcium level (kg/plot) Plot Preburn Postburn 50 9 50 18 82 45 64 18 82 18 73 9. 77 32 54 9 23 18 10…
A: Since you have asked multiple questions, we will solve the first question for you. If you want any…
Q: values for the quarterly rate of return on a particular common stock investment: 4.8 2.8 9.9…
A:
Q: WHat is the confidence interval? Consider the following data on x = rainfall volume (m3) and y =…
A:
Q: construct the scatterplots for the following bivariate data: a. Age of a person, in years 11 12 13…
A: a. Procedure for the Scatter plot in the excel Step 1: Select the data. Step 2: Select Insert. Step…
Q: The following regression model was fitted to sample data with 12 observations: ŷ = 30 + 4.50x. What…
A: We have given that the following regression model was fitted to sample data with 12 observations: ŷ…
Q: Is there sufficient evidence to conclude that there is a linear correlation between court incomes…
A: Correlation tells us the strength of linear relationship between two variables.
Q: Given below are seven observations collected in a regression study on two variables, x (independent…
A: Solution To find the correlation coefficient we will use Excel
Q: Use the following ANOVA table for regression to answer the questions. Analysis of Variance…
A: Solution-: We have following table: Source of variation Degree of freedom Sum of squares Mean sum…
Q: a) What kind of relationship exist between the exam scores and the clas sizes? Interpret the…
A: The regression line is given by score = 95 -1.2Size There is a negative relationship between the…
Q: Suppose that a sample of n = 12 pairs of X and Y scores has SSY = 90 and a Pearson correlation of r…
A: The hypotheses are stated below: Obtain value of the test statistic. The value of the test…
Q: Computer output from a least-squares regression analysis based on a sample of size 17 is shown in…
A: It is given that output from a least-square regression analysis and the sample size is 17.
Q: The following table gives information on ages and cholesterol levels for a random sample of 10 men.…
A: “Since you have posted a question with multiple sub-parts, we will solve first three subparts for…
Q: Given the following data set, let x be the explanatory variable and y be the response variable. x…
A: For the given data set Find ( a ) If a least squares line was fitted to this data, what percentage…
Q: . Consider the following table: X 3 2 2 3 6 6 3 7 4 3 8 6 Y 25 15 9 28 65 60…
A: (a) Use EXCEL to obtain the regression equation. EXCEL procedure: Go to EXCEL Go to…
Q: Which of the following is not an assumption for the use of the Pearson-Product Moment Coefficient of…
A: Ans. Assumption for the use of the Pearson-Product Moment Coefficient of Correlation are; The…
Q: 3. Construct the scatterplots for the following bivariate data: a. b. Age of person, in years…
A:
Q: PQ -1. Consider the following data: 38 52 53 58 61 61 63 66 65 69 70 72 74 Complete the following:…
A:
Q: Here are two sets of bivariate data with the same response variable. The first contains the…
A: Correlation determines relationship between two quantitative variables . To find correlation…
Q: Monthly rent paid by undergraduates and graduate students. Undergraduate Student Rents (n = 10) 870…
A: Solution
Q: Based on the following table, what is the sample regression equation? Standard Coefficients Error t…
A: We have been given the output of regression. We have the regression equation given as,…
Q: Average daily darkness (h) Wildlife-vehicle incidents 10.2 76 10.4 81 10.6 96 11 66 11.2 114 11.8 93…
A: Let X represents the average daily darkness and Y represents the wildlife vehicles incidents.…
Q: Given below are seven observations collected in a regression study on two variables, x (independent…
A: x y 2 12 3 9 6 8 7 7 8 6 7 5 9 2
Q: The systolic blood pressure of individuals is thought to be related to both age and weight. Let the…
A: Given:
Q: Consider following sample information from a population of size 200 146 128 Y X; Estimate population…
A:
Q: You wish to determine if there is a negative linear correlation between the two variables at a…
A:
Q: The following figure represents the histogram and probability plot for three different data sets:…
A: Histogram: A simple bar graph of the data where the width bars are the range of the data and the…
Q: Consider following sample information from a population of size 200 146 128 224 137 206 Y X;…
A:
Q: b. A study conducted to compare the breakdown voltage in two insulating liquids, yields the voltage…
A: Confidence interval is calculated by the combined value of sample statistic and the margin of error.…
Q: Two plots at Rothamsted Experimental Station were studied for production of wheat straw. For a…
A: F-test: It is the hypothesis testing for the variance of two populations are equal or different. By…
Q: The following table illustrates the BMI for a number of patients recently enrolled in a study…
A: σ=2.4 kg/m2 Participant BMI (kg/m2) A 26.5 B 19.2 C 29.7 D 27.4 E 30.2 F 28.9
Q: A college professor is interested in finding out if there is a relationship between the post-test…
A:
Q: A statistical program is recommended. Consider the following data for a dependent variable y and two…
A: Given: x1 x2 y 30 12 94 47 10 108 25 17 112 51 16 178 40 5 94 51 19 175 74 7…
Q: Given the following data set, let x be the explanatory variable and y be the response variable.…
A: Given data : sr.no X Y 1 6 4 2 1 9 3 3 8 4 7 3 5 5 5 6 2 8 7 3 7
Q: Years Sales 1 80 3 97 4 92 4 102 6 103 8 111 10 119 10 123 11 117 13 136
A: Regression is an inferential statistical procedure.
Q: Use the following ANOVA table for regression to answer the questions. Analysis of Variance Source…
A: Solution: The given ANOVA table is
Q: The systolic blood pressure of individuals is thought to be related to both age and weight. Let the…
A: The pair, x1 and x3 are better. As the table suggests: x1 x2 x1 0.829 - x3 0.860 0.6661
Q: Two samples, sample one of size 16 and sample two of size 10, respectively, are drawn at random…
A: Given that: n1 = 16 , n2 = 10 S1= 24 , S1= 10 By using the formula of the ratio of…
Q: Given the following sample statistics X(bar) = 20, Y(bar) = 200, Sx= 100, Sy = 60, RxY = 0.4, n =…
A:
Q: Consider the following data set for the lifetime of 15 components drawn from an exponential…
A: Let x denotes the given sample data drawn from exponential distribution. Then, the mean and the…
Q: Consider the following set of dependent and independent variables. Use these data to complete parts…
A: Excel Procedure: Enter Y, x1 and x2 data in Excel>Go to Data>Click on Data Analysis>…
Q: 21. The following information was obtained from two independent samples selected from two normally…
A:
Q: In this problem, we use your critical values table to explore the significance ofr based on…
A: Introduction: Associated variables: Two variables are associated or related if the value of one…
Q: a) construct a 95% confidence interval for the regression coefficient for x1 and interpret its…
A: a. The regression analysis is conducted using EXCEL. The software procedure is given below: Enter…
Q: The following table lists the monthly incomes (in hundreds of dollars) and the monthly rents paid…
A: Note: Hey, since there are multiple subparts posted, we will answer first three subparts. If you…
Q: In a certain type of metal test specimen, the normal stress on a specimen is known to be…
A: Note: As you have posted multiple sub-parts, we have helped you solve the first three parts,…
Q: Consider the following hypothesis statement using a = 0.05 and data from two independent samples.…
A:
Q: Construct a 95% confidence interval for the average value of y for the following data. Use x = 25,…
A: Solution: Given information: The estimated regression equation is y^= 16.920+0.160x Se= 4.77…

Step by step
Solved in 2 steps with 2 images

- The following data are the monthly salaries and the grade point averages for students who obtained a bachelor's degree in business administration. GPA Monthly Salary ($) 2.6 3,600 3.4 3,900 3.6 4,300 3.2 3,800 3.5 4,200 2.9 3,900 The estimated regression equation for these data is and . Use Table 1 of Appendix B. a. Develop a point estimate of the starting salary for a student with a GPA of (to 1 decimal). b. Develop a confidence interval for the mean starting salary for all students with a GPA (to 2 decimals). ( , ) c. Develop a prediction interval for Ryan Dailey, a student with a GPA of (to 2 decimals). ( , ) d. Discuss the differences in your answers to parts (b) and (c).Use the following information from a multiple regression analysis. n=15 b1=2 b2=6 Sb1=1.4 Sb2=0.5 a. Which variable has the largest slope, in units of a t statistic? b. Construct a 90% confidence interval estimate of the population slope, β1. c. At the 0.10 level of significance, determine whether each independent variable makes a significant contribution to the regression model. On the basis of these results, indicate the independent variables to include in this model.Given below are seven observations collected in a regression study on two variables, x (independent variable) and y (dependent variable). Copy and paste the numbers in an Excel worksheet and then use Excel's Regression tool to conduct a simple linear regression analysis. Choose 95% confidence level. Answer the following questions: x y 2 12 3 9 6 8 7 7 8 6 7 5 9 2 Find out regression coefficient b1 (Keep 2 decimal places) Find out SSR (Keep 2 decimal places) Find out SST (Only report the integer part)
- For each of the following scenarios, select the test (from the choices below), that is most appropriate for analyzing the data. a) Z-test b) One-sample t-test c) Independent t-test d) Dependent t-test e) 1-Way ANOVA f) Regression/Correlation g) Chi-Square 1. Does caffeine help test performance? 90 participants are randomly assigned to one of 4 groups (no caffeine, small dose, medium dose, and large dose) and then asked to complete a GRE math section. 2. Do seniors study for fewer hours per week than freshmen? 3. Is the average SAT math score of Hunter College students higher than the national average (μ = 500, σ = 100)?Given below are seven observations collected in a regression study on two variables, x (independent variable) and y (dependent variable). Copy and paste the numbers in an Excel worksheet and then use Excel's Regression tool to conduct a simple linear regression analysis. Choose 95% confidence level. Answer the following questions: x y 2 12 3 9 6 8 7 7 8 6 7 5 9 2 t statistics is statistically significant at 5% level. Answer Yes or No. Yes No What is the lower bound of the 95% confidence interval for the independent variable x (Keep 2 decimal places) What is the upper bound of the 95% confidence interval for the independent variable x (Keep 2 decimal places)Given below are seven observations collected in a regression study on two variables, x (independent variable) and y (dependent variable). Copy and paste the numbers in an Excel worksheet and then use Excel's Regression tool to conduct a simple linear regression analysis. Choose 95% confidence level. Answer the following questions: x y 2 12 3 9 6 8 7 7 8 6 7 5 9 2 Find out F Statistics (Only report the integer part) F Statistics is statistically significant at 5% level. Answer Yes or No. Yes No Find out t statistics for the independent variable x (Keep 2 decimal places) t statistics is statistically significant at 5% level. Answer Yes or No. Yes No What is the lower bound of the 95% confidence interval for the independent variable x (Keep 2 decimal places) What is the upper bound of the 95% confidence interval for the independent variable x (Keep 2 decimal places)
- Consider the following set of dependent and independent variables. Use these data to answer questions a and b in the photos below. y 47 44 40 40 27 21 19 15 9 x1 22 32 18 19 10 18 8 15 9 x2 71 60 81 55 42 46 32 17 16 a) construct a 95% confidence interval for the regression coefficient for x1 and interpret its meaning. -the 95% confidence interval for the true population b1 is ___ to ___. b) Construxt a 95% confidence interval for the regression coefficient for x2 and interpret its meaning. -the 95% confidence interval for the true population coefficient b2 is ___ to ___. Please help!!In exercise 12, the following data on x = average daily hotel room rate and y = amount spent on entertainment (The Wall Street Journal, August 18, 2011) lead to the estimated regression equation ŷ = 17.49 + 1.0334x. For these data SSE = 1541.4. Use Table 1 of Appendix B.Click on the datafile logo to reference the data. a. Predict the amount spent on entertainment for a particular city that has a daily room rate of $89 (to 2 decimals).$ b. Develop a 95% confidence interval for the mean amount spent on entertainment for all cities that have a daily room rate of $89 (to 2 decimals).$ to $ c. The average room rate in Chicago is $128. Develop a 95% prediction interval for the amount spent on entertainment in Chicago (to 2 decimals).$ to $Suppose you estimated the relationship between the exam scores and class sizes. score^ = b0 + b1*Size + e^ Based on the OLS estimate, you obtain the following standard errors and parameter estimates: b0= 95; se(b0) = 30 ; b1= −1.2; se(b1 ) = 0.4 ; n = 25 a) What kind of relationship exist between the exam scores and the clas sizes? Interpret the regression. b) Conduct the following hypothesis test at the 1% significance level: H0 : b1 ≥ 0 H1 : b1 < 0 In your answer draw the distribution of the test statistic that you use, and clearly define the rejection region(s), indicating the critical value(s).
- In exercise 12, the following data on x = average daily hotel room rate and y = amount spent on entertainment (The Wall Street Journal, August 18, 2011) lead to the estimated regression equation ŷ = 17.49 + 1.0334x. For these data SSE = 1541.4.Click on the datafile logo to reference the data. Use Table 1 of Appendix B. a. Predict the amount spent on entertainment for a particular city that has a daily room rate of $89 (to 2 decimals).$ b. Develop a 95% confidence interval for the mean amount spent on entertainment for all cities that have a daily room rate of $89 (to 2 decimals).$ to $ c. The average room rate in Chicago is $128. Develop a 95% prediction interval for the amount spent on entertainment in Chicago (to 2 decimals).WHat is the confidence interval? Consider the following data on x = rainfall volume (m3) and y = runoff volume (m3) for a particular location. x 5 12 14 18 23 30 40 46 55 67 72 83 96 112 127 y 4 10 13 14 15 25 27 45 38 46 53 71 82 99 105 Use the accompanying Minitab output to decide whether there is a useful linear relationship between rainfall and runoff. The regression equation isrunoff = -2.05 + 0.847 rainfall Predictor Coef Stdev t-ratio p Constant -2.049 2.251 -0.91 0.379 rainfall 0.84717 0.03465 24.45 0.000 s = 4.978 R-sq = 97.9% R-sq(adj) = 97.7% State the appropriate null and alternative hypotheses. H0: β1 = 0 Ha: β1 ≠ 0 H0: β1 ≠ 0 Ha: β1 = 0 H0: β1 = 0 Ha: β1 < 0 H0: β1 = 0 Ha: β1 > 0 Compute the test statistic value and find the P-value. (Round your test statistic to two decimal places and your P-value to three decimal places.) t = P-value = State the conclusion in the problem context. (Use α = 0.05.) Reject H0. There…Suppose we are making predictions of the dependent variable y for specific values of the independent variable x using a simple linear regression model holding the confidence level constant. Let Width (C.I) = the width of the confidence interval for the average value y for a given value of x, and Width (P.I) = the width of the prediction interval for a single value y for a given value of x. Which of the following statements is true? Width (C.I) = 0.5 Width (P.I) Width (C.I) = Width (P.I) Width (C.I) > Width (P.I) Width (C.I) < Width (P.I)