A stock analyst wondered whether the mean rate of return of financial, energy, and utility stocks differed over the past 5 years. He obtained a simple random sample of eight companies from each of the three sectors and obtained the 5-year rates of return shown in the accompanying table (in percent). Complete parts (a) through (d) below. E Click the icon to view the data table. Rates of return (a) State the null and alternative hypotheses. Choose the correct answer below. A. Ho: Hinancial Henergy and H,: the means are different O B. Ho: at least one of the means is different and H,: Henancial = Henergy = Hutilities Financial Energy Utilities 10.76 15.12 12.89 11.98 C. Ho: Hinancial = Henergy = Hutilities and H, : Hinancial Honergy * Hutilities 13.91 5.76 17.01 6.33 13.46 D. Ho: Hanancial = Henergy Hutilties and H,: at least one of the means is different O 5.07 11.23 9.82 (b) Normal probability plots indicate that the sample data come from normal populations. Are the requirements to use the one-way ANOVA procedure sati 19.59 18.93 3.95 8.21 20.73 3.44 O A. Yes, because there are k= 3 simple random samples, one from each of k populations, the k samples are independent of each other, and the popu 10.45 9.60 7.11 B. Yes, because there are k= 3 simple random samples, one from each of k populations, the k samples are independent of each other, and the popu 6.75 17.40 15.70 No, because there are k =3 simple random samples, one from each of k populations, the k samples are independent of each other, and the popul O D. No, because the largest sample standard deviation is more than twice the smallest sample standard deviation. Oc. (c) Are the mean rates of return different at the a = 0.05 level of significance? Print Done Use technology to find the F-test statistic for this data set. Fo = (Round to two decimal places as needed.)
A stock analyst wondered whether the mean rate of return of financial, energy, and utility stocks differed over the past 5 years. He obtained a simple random sample of eight companies from each of the three sectors and obtained the 5-year rates of return shown in the accompanying table (in percent). Complete parts (a) through (d) below. E Click the icon to view the data table. Rates of return (a) State the null and alternative hypotheses. Choose the correct answer below. A. Ho: Hinancial Henergy and H,: the means are different O B. Ho: at least one of the means is different and H,: Henancial = Henergy = Hutilities Financial Energy Utilities 10.76 15.12 12.89 11.98 C. Ho: Hinancial = Henergy = Hutilities and H, : Hinancial Honergy * Hutilities 13.91 5.76 17.01 6.33 13.46 D. Ho: Hanancial = Henergy Hutilties and H,: at least one of the means is different O 5.07 11.23 9.82 (b) Normal probability plots indicate that the sample data come from normal populations. Are the requirements to use the one-way ANOVA procedure sati 19.59 18.93 3.95 8.21 20.73 3.44 O A. Yes, because there are k= 3 simple random samples, one from each of k populations, the k samples are independent of each other, and the popu 10.45 9.60 7.11 B. Yes, because there are k= 3 simple random samples, one from each of k populations, the k samples are independent of each other, and the popu 6.75 17.40 15.70 No, because there are k =3 simple random samples, one from each of k populations, the k samples are independent of each other, and the popul O D. No, because the largest sample standard deviation is more than twice the smallest sample standard deviation. Oc. (c) Are the mean rates of return different at the a = 0.05 level of significance? Print Done Use technology to find the F-test statistic for this data set. Fo = (Round to two decimal places as needed.)

Glencoe Algebra 1, Student Edition, 9780079039897, 0079039898, 2018
18th Edition
ISBN:9780079039897
Author:Carter
Publisher:Carter
Chapter10: Statistics
Section10.4: Distributions Of Data
Problem 19PFA

Related questions
Question
Help finding:
- Are the mean rates of return different at the
α=0.05level of significance?
- what is the F0
- What is the P value
- is there enough evidence to reject the null hypothesis.
- Draw boxplots of the three sectors to support the results obtained in part (c).
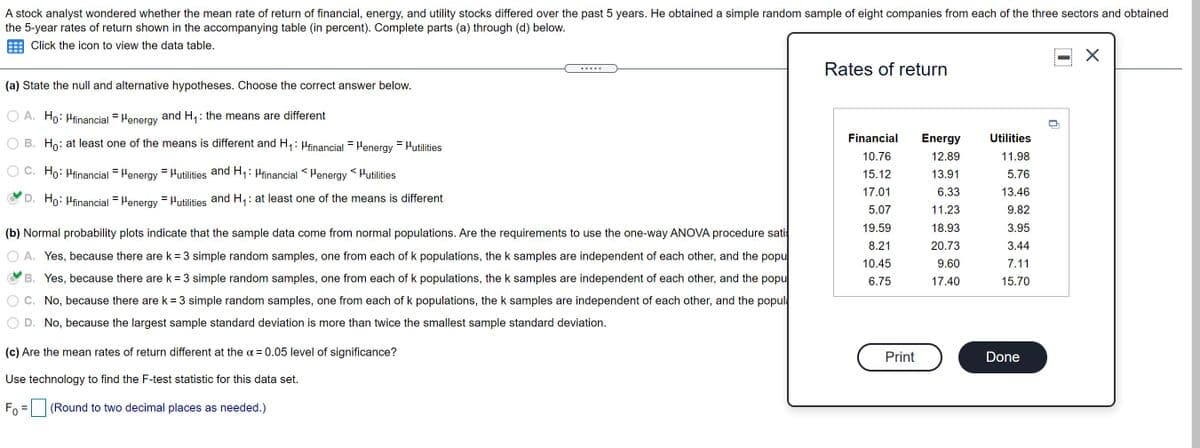
Transcribed Image Text:A stock analyst wondered whether the mean rate of return of financial, energy, and utility stocks differed over the past 5 years. He obtained a simple random sample of eight companies from each of the three sectors and obtained
the 5-year rates of return shown in the accompanying table (in percent). Complete parts (a) through (d) below.
Click the icon to view the data table.
Rates of return
.....
(a) State the null and alternative hypotheses. Choose the correct answer below.
O A. Ho: Hfinancial = Heneray and H,: the means are different
B. Ho: at least one of the means is different and H,: Hfinancial = Henergy = Hutilities
Financial
Energy
Utilities
10.76
12.89
11.98
Ho: Hfinancial = Henergy = Hutilities and H: Hfinancial <Henergy <Hutilities
15.12
13.91
5.76
17.01
6.33
13.46
D. Ho: Hfinancial = Heneray = Hutilities and H: at least one of the means is different
5.07
11.23
9.82
19.59
18.93
3.95
(b) Normal probability plots indicate that the sample data come from normal populations. Are the requirements to use the one-way ANOVA procedure sati
8.21
20.73
3.44
A. Yes, because there are k = 3 simple random samples, one from each of k populations, the k samples are independent of each other, and the popu
10.45
9.60
7.11
B. Yes, because there are k 3 simple random samples, one from each of k populations, the k samples are independent of each other, and the popu
6.75
17.40
15.70
C. No, because there are k = 3 simple random samples, one from each of k populations, thek samples are independent of each other, and the popul
D. No, because the largest sample standard deviation is more than twice the smallest sample standard deviation.
(c) Are the mean rates of return different at the a = 0.05 level of significance?
Print
Done
Use technology to find the F-test statistic for this data set.
Fo = (Round to two decimal places as needed.)
Expert Solution
This question has been solved!
Explore an expertly crafted, step-by-step solution for a thorough understanding of key concepts.

This is a popular solution!

Trending now
This is a popular solution!

Step by step
Solved in 3 steps with 2 images

Recommended textbooks for you
Glencoe Algebra 1, Student Edition, 9780079039897…
Algebra
ISBN:
9780079039897
Author:
Carter
Publisher:
McGraw Hill
Glencoe Algebra 1, Student Edition, 9780079039897…
Algebra
ISBN:
9780079039897
Author:
Carter
Publisher:
McGraw Hill