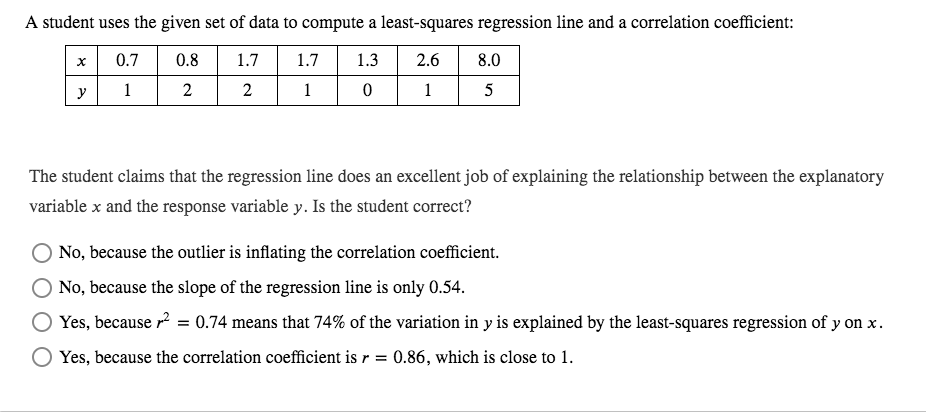
A student uses the given set of data to compute a least-squares regression line and a correlation coefficient: 0.7 0.8 1.7 1.7 1.3 2.6 8.0 y 1 2 1 1 5 The student claims that the regression line does an excellent job of explaining the relationship between the explanatory variable x and the response variable y. Is the student correct? No, because the outlier is inflating the correlation coefficient. No, because the slope of the regression line is only 0.54. Yes, because r2 = 0.74 means that 74% of the variation in y is explained by the least-squares regression of y on x. Yes, because the correlation coefficient is r = 0.86, which is close to 1. 2.


Correlation
Correlation defines a relationship between two independent variables. It tells the degree to which variables move in relation to each other. When two sets of data are related to each other, there is a correlation between them.
Linear Correlation
A correlation is used to determine the relationships between numerical and categorical variables. In other words, it is an indicator of how things are connected to one another. The correlation analysis is the study of how variables are related.
Regression Analysis
Regression analysis is a statistical method in which it estimates the relationship between a dependent variable and one or more independent variable. In simple terms dependent variable is called as outcome variable and independent variable is called as predictors. Regression analysis is one of the methods to find the trends in data. The independent variable used in Regression analysis is named Predictor variable. It offers data of an associated dependent variable regarding a particular outcome.


Trending now
This is a popular solution!

Step by step
Solved in 3 steps with 5 images


