A student was asked to find a 99% confidence interval for widget width using data from a random sample of size n = 15. Which of the following is a correct interpretation of the interval 12.2 < µ < 35? Check all that are correct. OThere is a 99% chance that the mean of a sample of 15 widgets will be between 12.2 and 35. OWith 99% confidence, the mean width of all widgets is between 12.2 and 35. O The mean width of all widgets is between 12.2 and 35, 99% of the time. We know this is true because the mean of our sample is between 12.2 and 35. OThere is a 99% chance that the mean of the population is between 12.2 and 35. O With 99% confidence, the mean width of a randomly selected widget will be between 12.2 and 35.
A student was asked to find a 99% confidence interval for widget width using data from a random sample of size n = 15. Which of the following is a correct interpretation of the interval 12.2 < µ < 35? Check all that are correct. OThere is a 99% chance that the mean of a sample of 15 widgets will be between 12.2 and 35. OWith 99% confidence, the mean width of all widgets is between 12.2 and 35. O The mean width of all widgets is between 12.2 and 35, 99% of the time. We know this is true because the mean of our sample is between 12.2 and 35. OThere is a 99% chance that the mean of the population is between 12.2 and 35. O With 99% confidence, the mean width of a randomly selected widget will be between 12.2 and 35.

Glencoe Algebra 1, Student Edition, 9780079039897, 0079039898, 2018
18th Edition
ISBN:9780079039897
Author:Carter
Publisher:Carter
Chapter10: Statistics
Section10.4: Distributions Of Data
Problem 19PFA

Related questions

Question
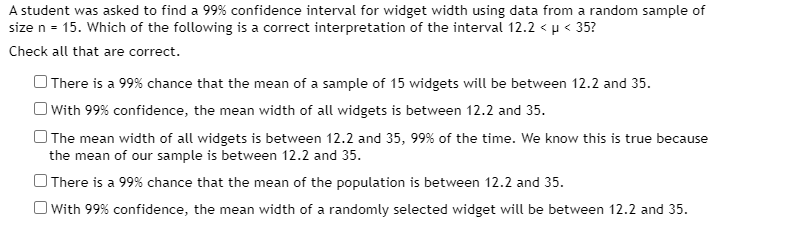
Transcribed Image Text:A student was asked to find a 99% confidence interval for widget width using data from a random sample of
size n = 15. Which of the following is a correct interpretation of the interval 12.2 < µ < 35?
Check all that are correct.
OThere is a 99% chance that the mean of a sample of 15 widgets will be between 12.2 and 35.
OWith 99% confidence, the mean width of all widgets is between 12.2 and 35.
O The mean width of all widgets is between 12.2 and 35, 99% of the time. We know this is true because
the mean of our sample is between 12.2 and 35.
OThere is a 99% chance that the mean of the population is between 12.2 and 35.
O With 99% confidence, the mean width of a randomly selected widget will be between 12.2 and 35.
Expert Solution
This question has been solved!
Explore an expertly crafted, step-by-step solution for a thorough understanding of key concepts.

This is a popular solution!

Trending now
This is a popular solution!

Step by step
Solved in 2 steps

Knowledge Booster


Learn more about
Need a deep-dive on the concept behind this application? Look no further. Learn more about this topic, probability and related others by exploring similar questions and additional content below.Recommended textbooks for you
Glencoe Algebra 1, Student Edition, 9780079039897…
Algebra
ISBN:
9780079039897
Author:
Carter
Publisher:
McGraw Hill
Glencoe Algebra 1, Student Edition, 9780079039897…
Algebra
ISBN:
9780079039897
Author:
Carter
Publisher:
McGraw Hill