A student was supplied with a stop watch, two metre rules and a simple pendulum suspended from a ceiling and was asked to measure the height of the ceiling indirectly. He set the pendulum swinging through a small angle and measured the period of oscillation for different lengths of the pendulum. Since he was unable to measure the length of the pendulum directly, he measured the height of the centre of the pendulum bob above the floor. He obtained the results tabulated below. Height of bob above floor Time for 50 oscillations (mm) (s) 400 155.3 600 148.8 800 142.2 1000 134.0 1200 127.4 1400 119.2 1600 110.5 The period Tof the pendulum of length e is given by T = 2n where g is the acceleration due to gravity. But e = H -h where H is the height of the ceiling and h is the height of the centre of the pendulum above the floor. Therefore T = 2n Plot a suitable graph to find the height of the ceiling H from the two intercepts using linear regression to fit the best straight line through the data points. Assume that g = 9.8 m s-2 (g %3D could be obtained from the slope of the graph). Having obtained your values for H, answer the following questions:
A student was supplied with a stop watch, two metre rules and a simple pendulum suspended from a ceiling and was asked to measure the height of the ceiling indirectly. He set the pendulum swinging through a small angle and measured the period of oscillation for different lengths of the pendulum. Since he was unable to measure the length of the pendulum directly, he measured the height of the centre of the pendulum bob above the floor. He obtained the results tabulated below. Height of bob above floor Time for 50 oscillations (mm) (s) 400 155.3 600 148.8 800 142.2 1000 134.0 1200 127.4 1400 119.2 1600 110.5 The period Tof the pendulum of length e is given by T = 2n where g is the acceleration due to gravity. But e = H -h where H is the height of the ceiling and h is the height of the centre of the pendulum above the floor. Therefore T = 2n Plot a suitable graph to find the height of the ceiling H from the two intercepts using linear regression to fit the best straight line through the data points. Assume that g = 9.8 m s-2 (g %3D could be obtained from the slope of the graph). Having obtained your values for H, answer the following questions:

Related questions
Question
Which value of H do you consider to be least accurate? Give reasons for your answer and explain how the accuracy could have been improved.
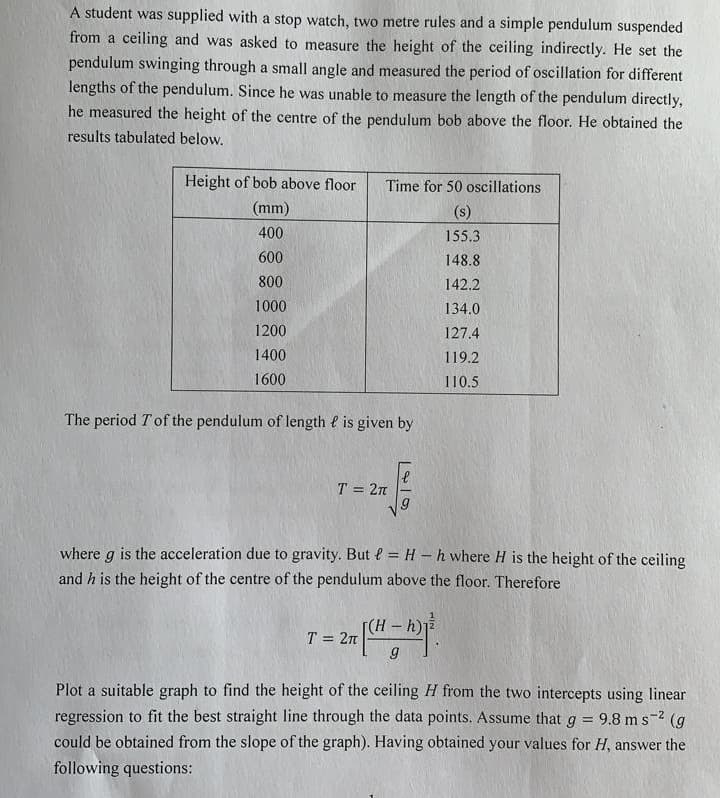
Transcribed Image Text:A student was supplied with a stop watch, two metre rules and a simple pendulum suspended
from a ceiling and was asked to measure the height of the ceiling indirectly. He set the
pendulum swinging through a small angle and measured the period of oscillation for different
lengths of the pendulum. Since he was unable to measure the length of the pendulum directly,
he measured the height of the centre of the pendulum bob above the floor. He obtained the
results tabulated below.
Height of bob above floor
Time for 50 oscillations
(mm)
(s)
400
155.3
600
148.8
800
142.2
1000
134.0
1200
127.4
1400
119.2
1600
110.5
The period Tof the pendulum of length e is given by
T = 2n
where g is the acceleration due to gravity. But e = H -h where H is the height of the ceiling
and h is the height of the centre of the pendulum above the floor. Therefore
T = 2n
Plot a suitable graph to find the height of the ceiling H from the two intercepts using linear
regression to fit the best straight line through the data points. Assume that
g = 9.8 m s-2
(g
%3D
could be obtained from the slope of the graph). Having obtained your values for H, answer the
following questions:
Expert Solution
This question has been solved!
Explore an expertly crafted, step-by-step solution for a thorough understanding of key concepts.

This is a popular solution!

Trending now
This is a popular solution!

Step by step
Solved in 2 steps with 2 images
