A student working on a summer internship in the economic research office of a large corporation, studied the relation between sales of a product (in million dollars) and population in the firm's 50 marketing districts. The computer output appears below: T VALUE PARAMETER STD ERROR PR >T 7.411 0.002 INTERCEPT 1.9802 2.1756 POPULATION 0.7550 0.2192 0.1043 0.018 The fitted regression line is: OY= 0.755 +7.411X OY= 7.411+0.755X O Y = 2.1756 + 0.1043X OY=7.411+ 7.55X
A student working on a summer internship in the economic research office of a large corporation, studied the relation between sales of a product (in million dollars) and population in the firm's 50 marketing districts. The computer output appears below: T VALUE PARAMETER STD ERROR PR >T 7.411 0.002 INTERCEPT 1.9802 2.1756 POPULATION 0.7550 0.2192 0.1043 0.018 The fitted regression line is: OY= 0.755 +7.411X OY= 7.411+0.755X O Y = 2.1756 + 0.1043X OY=7.411+ 7.55X

Algebra & Trigonometry with Analytic Geometry
13th Edition
ISBN:9781133382119
Author:Swokowski
Publisher:Swokowski
Chapter7: Analytic Trigonometry
Section7.6: The Inverse Trigonometric Functions
Problem 91E

Related questions
Question
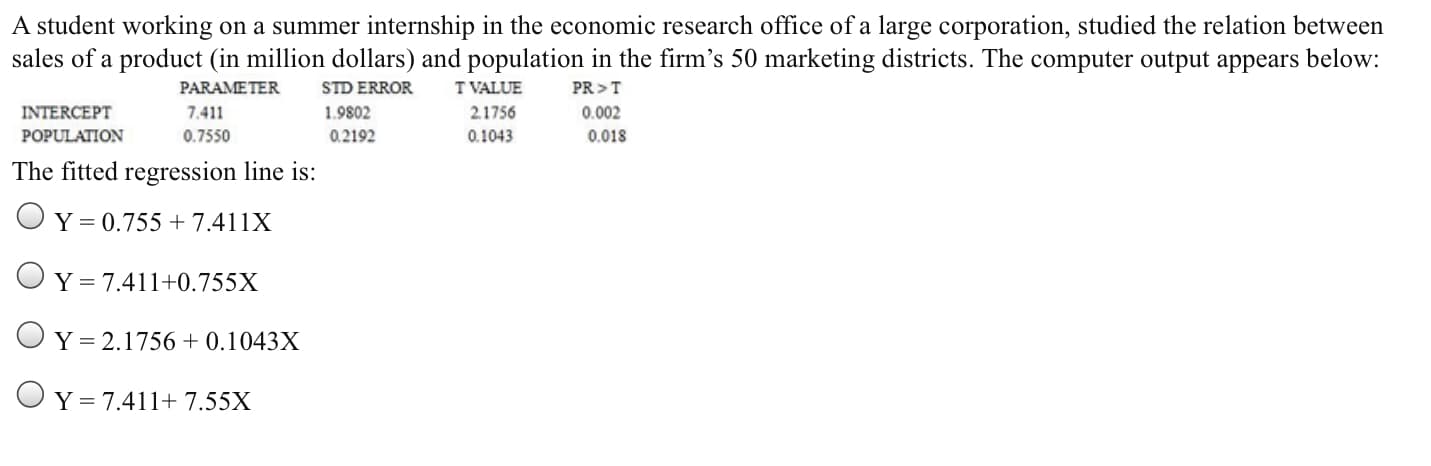
Transcribed Image Text:A student working on a summer internship in the economic research office of a large corporation, studied the relation between
sales of a product (in million dollars) and population in the firm's 50 marketing districts. The computer output appears below:
T VALUE
PARAMETER
STD ERROR
PR >T
7.411
0.002
INTERCEPT
1.9802
2.1756
POPULATION
0.7550
0.2192
0.1043
0.018
The fitted regression line is:
OY= 0.755 +7.411X
OY= 7.411+0.755X
O Y = 2.1756 + 0.1043X
OY=7.411+ 7.55X
Expert Solution
This question has been solved!
Explore an expertly crafted, step-by-step solution for a thorough understanding of key concepts.

This is a popular solution!

Trending now
This is a popular solution!

Step by step
Solved in 3 steps with 2 images

Recommended textbooks for you
Algebra & Trigonometry with Analytic Geometry
Algebra
ISBN:
9781133382119
Author:
Swokowski
Publisher:
Cengage

Linear Algebra: A Modern Introduction
Algebra
ISBN:
9781285463247
Author:
David Poole
Publisher:
Cengage Learning

Functions and Change: A Modeling Approach to Coll…
Algebra
ISBN:
9781337111348
Author:
Bruce Crauder, Benny Evans, Alan Noell
Publisher:
Cengage Learning
Algebra & Trigonometry with Analytic Geometry
Algebra
ISBN:
9781133382119
Author:
Swokowski
Publisher:
Cengage
Linear Algebra: A Modern Introduction
Algebra
ISBN:
9781285463247
Author:
David Poole
Publisher:
Cengage Learning
Functions and Change: A Modeling Approach to Coll…
Algebra
ISBN:
9781337111348
Author:
Bruce Crauder, Benny Evans, Alan Noell
Publisher:
Cengage Learning