A study published in the American Journal of Public Health was conducted to determine whether the use of seat belts in motor vehicles depends on ethnic status in San Diego County. A sample of 792 children treated for injuries sustained from motor vehicle accidents was obtained, and each child was classified according to (1) ethnic status (Hispanic or non-Hispanic) and (2) seat belt usage (worn or not worn) during the accident. The number of children in each category is given in the table below. Hispanic Non-Hispanic Seat belts worn 31 148 Seat belts not worn 283 330 Referring to these data, the calculated test statistic is: Seleccione una: A. nearly -0.1368 O B. approximately -0.9991 O C. approximately 72.8063 D. about 48.1849
A study published in the American Journal of Public Health was conducted to determine whether the use of seat belts in motor vehicles depends on ethnic status in San Diego County. A sample of 792 children treated for injuries sustained from motor vehicle accidents was obtained, and each child was classified according to (1) ethnic status (Hispanic or non-Hispanic) and (2) seat belt usage (worn or not worn) during the accident. The number of children in each category is given in the table below. Hispanic Non-Hispanic Seat belts worn 31 148 Seat belts not worn 283 330 Referring to these data, the calculated test statistic is: Seleccione una: A. nearly -0.1368 O B. approximately -0.9991 O C. approximately 72.8063 D. about 48.1849

Glencoe Algebra 1, Student Edition, 9780079039897, 0079039898, 2018
18th Edition
ISBN:9780079039897
Author:Carter
Publisher:Carter
Chapter10: Statistics
Section10.6: Summarizing Categorical Data
Problem 27PPS

Related questions

Topic Video
Question
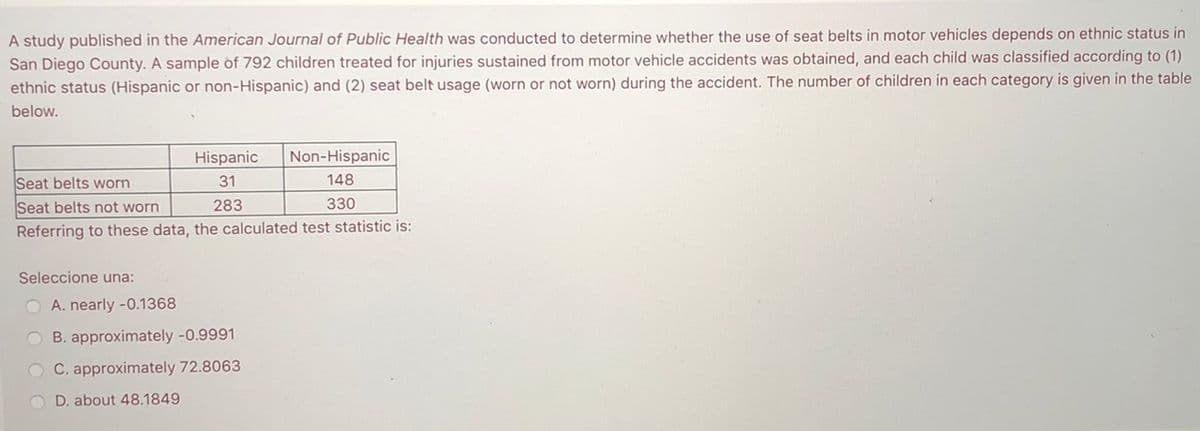
Transcribed Image Text:A study published in the American Journal of Public Health was conducted to determine whether the use of seat belts in motor vehicles depends on ethnic status in
San Diego County. A sample of 792 children treated for injuries sustained from motor vehicle accidents was obtained, and each child was classified according to (1)
ethnic status (Hispanic or non-Hispanic) and (2) seat belt usage (worn or not worn) during the accident. The number of children in each category is given in the table
below.
Hispanic
Non-Hispanic
Seat belts worn
31
148
Seat belts not worn
283
330
Referring to these data, the calculated test statistic is:
Seleccione una:
O A. nearly -0.1368
B. approximately -0.9991
O C. approximately 72.8063
O D. about 48.1849
Expert Solution
This question has been solved!
Explore an expertly crafted, step-by-step solution for a thorough understanding of key concepts.

This is a popular solution!

Trending now
This is a popular solution!

Step by step
Solved in 2 steps with 1 images

Knowledge Booster


Learn more about
Need a deep-dive on the concept behind this application? Look no further. Learn more about this topic, statistics and related others by exploring similar questions and additional content below.Recommended textbooks for you
Glencoe Algebra 1, Student Edition, 9780079039897…
Algebra
ISBN:
9780079039897
Author:
Carter
Publisher:
McGraw Hill

Holt Mcdougal Larson Pre-algebra: Student Edition…
Algebra
ISBN:
9780547587776
Author:
HOLT MCDOUGAL
Publisher:
HOLT MCDOUGAL

Glencoe Algebra 1, Student Edition, 9780079039897…
Algebra
ISBN:
9780079039897
Author:
Carter
Publisher:
McGraw Hill
Holt Mcdougal Larson Pre-algebra: Student Edition…
Algebra
ISBN:
9780547587776
Author:
HOLT MCDOUGAL
Publisher:
HOLT MCDOUGAL