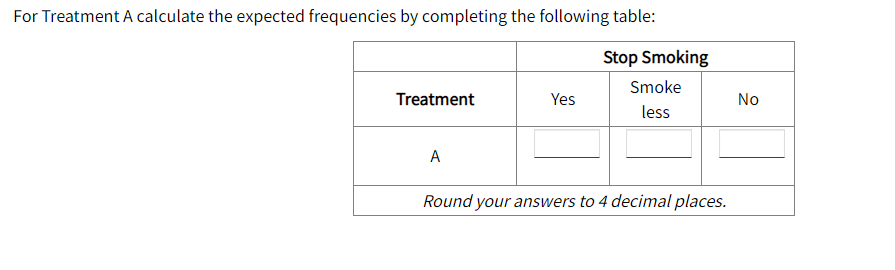
A study was performed to compare two treatment regimens for smokers who wish to stop smoking. The two treatments are: • Treatment A: Use Nicorette chewing gum, which is a nicotine replacement. • Treatment B: Switch to e-cigarettes. A total of 500 smokers were randomly allocated to one of the two treatments. The outcome after 12 weeks is summarised in the following co table. Stop Smoking Smoke Treatment Yes No Total less A 76 16 108 200 В 78 54 168 300


Q: In an article Shelf-Space Strategy in Retailing, published in the Proceedings: Southern Marketing…
A: In order to determine whether there is significant difference in the average daily sales of…
Q: The success of an airline depends heavily on its ability to provide a pleasant customer experience.…
A: Enter the Data in Excel as shown below and use the Formula to calculate the sample mean and standard…
Q: Two opposing opinions were shown to a random sample of 1,500 buyers of a particular political news…
A: Given: n = 1500 39% chose opinion A 54% chose opinion B 7% chose Neutral Formula Used:
Q: A researcher is conducting an experimental study on the effect of aspirin on heart attack risk. In…
A: Systematic Sample: The systematic sample is a probability sampling method, which is used to select…
Q: FILE Robert Altoff is vice president of engineering for a manufacturer of household washing…
A: "Since you have posted a question with multiple subparts, we will solve first 3 sub-parts for you.…
Q: A political pollster selects a random sample of 75 registered voters from Allegheny County,…
A:
Q: n this exercise, a two-way table is shown for two groups, 1 and 2, and two possible outcomes, A and…
A:
Q: b) A study compared an anti-depressant effect on three different drugs. The patients are randomly…
A: Note: As per answering guidelines I have to answer only one question at a time. Please repost the…
Q: Mary and Gary are both doing research on the effects of sleep deprivation on critical thinking. Mary…
A: Hello! Thank you for the question. As per the honor code, we are allowed to answer three sub parts…
Q: A political pollster selects a random sample of 75 registered voters from Allegheny County,…
A: SOLUTION. Given the researcher wants to determine if the distribution of political party preference…
Q: the price of oil rises, there is increased worldwide interest in alternate sources of energy. The…
A: Observed frequency (O) table: a)how large was the sample? = 6451
Q: In Exercises, we present descriptions of designed experiments. In each case, identify the…
A: a)Experimental units:In a designed experiment, the experimental units are defined as the items or…
Q: An article in the journal Applied Nutritional Investigation reported the results of a comparison of…
A: There are two different weight-loss programs which are named as soy group and traditional group.…
Q: The director of student services at San Bernardino Valley College is interested in whether women are…
A: 1)
Q: The authors of the paper "Playing by the Rules: Parental Mediation of Video Game Play"+ used data…
A: Given Information: The authors of the paper examined the methods by which parents monitor their…
Q: A local high school has both male and female students. Each student either plays a sport or doesn't.…
A: Given, FEMALE MALE TOTAL NO SPORT 12 15 27 SPORT 36 17 53 TOTAL 48 32 80 Let Sports be…
Q: A poll surveyed people in six countries to assess attitudes toward a variety of alternate forms of…
A: Given data: Great Britain France Italy Spain Germany United States Strongly favor 133 298 161…
Q: Is there a relationship between treatment and smoking cessation? A study randomly selects a group of…
A: The chi square is used to measure whether there is any relationship between the categorical…
Q: As part of a study designed to compare hybrid and similarly equipped conventional vehides, a group…
A: we will convert given data into 2x4 table so that we can use software to calculate analysis of…
Q: A manufacturing company that produces laminate for countertops is interested in studying the…
A: Obtain the 99%prediction interval for the number of defects per countertop. The 99%prediction…
Q: Rats were given one of four different diets at random, and the response measure was liver weights as…
A: Please note that as per our guideline we can answer three sub-parts only. Please repost the…
Q: In a study of the demand for life insuranoe, Executive Insurers, Inc., is examining the factors that…
A: Note: Hi there! Thank you for posting the question. As your question has more than 3 parts, we have…
Q: #6) Highlands State College is doing a study to determine if fees for course schedule changes have…
A: 6 State the hypotheses. Null hypothesis: Alternative hypothesis: Obtain the expected frequencies…
Q: Professor Wonka is interested in whether candy influences children's mood. One group of children is…
A: The formula for effect size is obtained as given below: Effect…
Q: In USE SALT Use the given information to construct a 90% confidence interval for the difference in…
A: Given : For Sample 1x1=42.41n1=31 s1=9.51 For Sample 2 x2=58.18 n2=31…
Q: The Consumer Reports Restaurant Customer Satisfaction Survey is based upon 148,599 visits to…
A: Researchers conduct one-way ANOVA to test the significant difference in population means of three or…
Q: In a study about adult health in Gwinnett County, which method of data collection Would have the…
A:
Q: In a research to study the gender differences in receiving Lidocaine therapy in Acure Myocardial…
A: H0: Null Hypothesis: The receiving Lidocaine therapy is independent of their gender. (Claim) HA:…
Q: Med. 6.54 To assess whether degreed nurses received a more comprehensive training than reg- istered…
A: Hi! Thank you for the question, As per the honor code, we are allowed to answer three sub-parts at a…
Q: In a survey of 3031 adults, a poll asked people whether they smoked cigarettes and whether they…
A: Two proportion Test
Q: Researchers found 300 current smokers to volunteer for a study in which each was randomly assigned…
A: The given data is, Group1 Group2 Group3 Did not quit 53 55 52 Quit 19 14 4
Q: A researcher is interested in investigating whether the military branch a person signs up for and…
A:
Q: The Consumer Reports Restaurant Customer Satisfaction Survey is based upon 148,599 visits to…
A: Using Excel >data analysis > one-way anova, we get :
Q: The London School of Economics and the Harvard Business School have conducted studies of how chief…
A: A frequency distribution is presenting the raw data in a table form with the specified class…
Q: 5. In a journal on clinical nutrition, one of the findings show that the type of workout or training…
A: Given the R COMMANDER output of the study that the type of workout or training has varying effect on…
Q: An article in the journal Applied Nutritional Investigation reported the results of a comparison of…
A: Solution
Q: Dean for student affairs of a small university is worried about students’ expenditure on internet…
A: 1). Since the population standard deviations are unknown and sample sizes are small, the normal…
Q: Members of fraternities and sororities are required to volunteer for community service. Do…
A: There are two independent samples which are Brothers and Sisters. Both samples come from population…
Q: The success of an airline depends heavily on its ability to provide a pleasant customer experience.…
A: It is given that the number of minutes each flight delayed for two different airlines.
Q: 5. In a journal on clinical nutrition, one of the findings show that the type of workout or training…
A: Solution: The Dr. Castillejo’s claim is that the average oxygen consumption differs among three…
Q: Marketing research has indicated that males and females may have different color preferences in…
A: Given that, Marketing research has indicated that males and females may have different color…
Q: An experiment was conducted to compare the effectiveness of four training programs A, B, C, and D in…
A: Decision Rule: IF the test statistic greater than the critical value, then reject the null…
Q: To achieve the suggested power of 0.80 in MANOVA when assessing medium effect sizes in a 5 group…
A: Given :The suggested power of 0.80 in MANOVA when assessing medium effect sizes in a 5 group design…
Q: Here is a two-way table that classifies these subjects by whether or not they had arthritis of the…
A: Given data: The two-way table that classifies these subjects by whether or not they had arthritis of…
Q: The results of a recent study regarding smoking and three types of illness are show Non-Smokers…
A: Since there are multiple sub-parts, as per the honor code the first three sub-parts will be solved.…
Q: In the book Business Research Methods, Donald R. Cooper and C. William Emory (1995) discuss a…
A: It is given that: For group A:x¯1 (sample mean)=1352s1 (sample standard deviation)=224For group…
Q: When a police officer responds to a call for help in a case of spousal abuse, what should the…
A: There are two categorical variables which are number of subsequent arrests and assigned treatments.…
Q: High School Band - In most US high schools, students can play an instrument in three types of bands.…
A: Chi-square test statistic : Where, O is observed frequency E is expected frequency Expected…
Q: A marketing director for a beverage company conducted a study to investigate people’s soda…
A: We will perform a chi square test of independence. Observed Frequencies East Coast West Coast…
Q: n an agricultural experiment, the effects of two fertilizers on the production of oranges were…
A: Given: Fertilizer A: Sample size n1=14 Sample mean x¯1=498.857 Sample standard deviation s1=24.8406…

Step by step
Solved in 2 steps with 2 images

- Based on a survey of 12,344 U.S. college students and 6,729 Canadian college students, Kuo, Adlaf, Lee, Gliksman, Demers, and Wechsler (2002) report that alcohol use is more common among Canadian than U.S. students, but heavy drinking (five or more drinks in a row for males, four or more for females) is significantly higher among U.S. students than Canadian students. Is this an example of a survey research design?The Coca-Cola Company introduced New Coke in 1985. Within three months of this introduction, negative consumer reaction forced Coca-Cola to reintroduce the original formula of Coke as Coca-Cola Classic. Suppose that two years later, in 1987, a marketing research firm in Chicago compared the sales of Coca-Cola Classic, New Coke, and Pepsi in public building vending machines. To do this, the marketing research firm randomly selected 10 public buildings in Chicago having both a Coke machine (selling Coke Classic and New Coke) and a Pepsi machine. The Coca-Cola Data and a MINITAB Output of a Randomized Block ANOVA of the Data: Building 1 2 3 4 5 6 7 8 9 10 Coke Classic 45 136 134 41 146 33 71 224 111 87 New Coke 6 114 56 14 39 20 42 156 61 140 Pepsi 24 90 100 43 51 42 68 131 74 107 Two-way ANOVA: Cans versus Drink, Building Source DF SS MS F P Drink 2 7997.6 3998.80 5.78 0.011 Building 9 55573.5 6174.83 8.93 0.000 Error 18 12443.7 691.32 Total 29 76014.8…The Coca-Cola Company introduced New Coke in 1985. Within three months of this introduction, negative consumer reaction forced Coca-Cola to reintroduce the original formula of Coke as Coca-Cola Classic. Suppose that two years later, in 1987, a marketing research firm in Chicago compared the sales of Coca-Cola Classic, New Coke, and Pepsi in public building vending machines. To do this, the marketing research firm randomly selected 10 public buildings in Chicago having both a Coke machine (selling Coke Classic and New Coke) and a Pepsi machine. The Coca-Cola Data and a MINITAB Output of a Randomized Block ANOVA of the Data: Building 1 2 3 4 5 6 7 8 9 10 Coke Classic 45 136 134 41 146 33 71 224 111 87 New Coke 6 114 56 14 39 20 42 156 61 140 Pepsi 24 90 100 43 51 42 68 131 74 107 Two-way ANOVA: Cans versus Drink, Building Source DF SS MS F P Drink 2 7997.6 3998.80 5.78 0.011 Building 9 55573.5 6174.83 8.93 0.000 Error 18 12443.7 691.32 Total 29…
- The Coca-Cola Company introduced New Coke in 1985. Within three months of this introduction, negative consumer reaction forced Coca-Cola to reintroduce the original formula of Coke as Coca-Cola Classic. Suppose that two years later, in 1987, a marketing research firm in Chicago compared the sales of Coca-Cola Classic, New Coke, and Pepsi in public building vending machines. To do this, the marketing research firm randomly selected 10 public buildings in Chicago having both a Coke machine (selling Coke Classic and New Coke) and a Pepsi machine.The Coca-Cola Data and a MINITAB Output of a Randomized Block ANOVA of the Data: Building 1 2 3 4 5 6 7 8 9 10 Coke Classic 42 133 131 50 148 33 64 210 106 86 New Coke 6 110 54 12 43 11 34 160 57 147 Pepsi 33 95 105 45 45 45 76 122 79 96 Two-way ANOVA: Cans versus Drink, Building Source DF SS MS F P Drink 2 7,208.5 3,604.23 4.59 .024 Building 9 51,209.2 5,689.91 7.25 .000 Error 18 14,132.2 785.12 Total 29…A pet food company has a business objective of expanding its product line beyond its current kidney- and shrimp-based cat foods. The company developed two new products, one based on chicken liver and the other based on salmon. The company conducted an experiment to compare the two new products with its two existing ones, as well as a generic beef-based product sold in a supermarket chain. For the experiment, a sample of 50 cats from the population at a local animal shelter was selected. Ten cats were randomly assigned to each of the five products being tested. Each of the cats was then presented with 3 ounces of the selected food in a dish at feeding time. The researchers defined the variable to be measured as the number of ounces of food that the cat consumed within a 10-minute time interval that began when the filled dish was presented. The results of this experiment are summarized in the following table: Kidney Shrimp Chicken Liver Salmon Beef 2.37 2.26…A random survey of health issues, conducted by the Department of Public Health of the Commonwealth of Massachusetts, examined the results from the state's seven largest cities. These cities were selected on the basis of their diverse racial and ethnic populations. The percentage of adults with diabetes in each city in the survey is given in the following table. City Boston Worcester Springfield Lowell Fall River Lawrence NewBedford Adults withDiabetes (%) 4.2 5.2 9.1 5.7 8.1 7.9 6.3 Find the average percentage of adults with diabetes in these seven cities. (Round your answer to two decimal places.) %What is the standard deviation for these data? (Round your answer to two decimal places.) %
- In a study of a group of women science majors who remained in their profession and a group who left their profession within a few months of graduation, the researchers collected the data shown here on a self-esteem questionnaire. Leavers Stayers1 = 3.05 2 = 2.92σ1 = 0.71 σ2 = 0.71n1 = 100 n2 = 227At α = 0.05, can it be concluded that there is a difference in the self-esteem scores of the two groups? Use the P-value method.Can the introduction of pleasant sensory stimuli lead to a more pleasant exercise environment and decrease perceived exertion during a four‑minute stepping task? Forty‑three students from a Southeastern University were assigned at random to three conditions: "taste," in which participants inserted a lemon‑flavored mouth guard during the task; "placebo," in which participants inserted a non‑flavored mouth guard; and "control," in which no mouth guard was used. Twelve students were assigned to the taste group, 15 to the placebo group, and 16 to the control group. Ratings of perceived exertion (RPE) scores were measured on a standard 15‑point scale ranging from 6 (very, very light) to 20 (exhausted). Select the populations and the response variable. The population is all humans. The response is the rating of perceived exertion. The populations are students who wear a lemon‑flavored mouth guard and students who wear a non‑flavored mouth guard. The response is the rating of perceived…Can the introduction of pleasant sensory stimuli lead to a more pleasant exercise environment and decrease perceived exertion during a four‑minute stepping task? Forty‑three students from a Southeastern University were assigned at random to three conditions: "taste," in which participants inserted a lemon‑flavored mouth guard during the task; "placebo," in which participants inserted a non‑flavored mouth guard; and "control," in which no mouth guard was used. Twelve students were assigned to the taste group, 15 to the placebo group, and 16 to the control group. Ratings of perceived exertion (RPE) scores were measured on a standard 15‑point scale ranging from 6 (very, very light) to 20 (exhausted).
- To determine a target audience for a new email package, a computer company surveyed a large random sample of potential customers, asking each whether he/she uses email on a regular basis. (The company considered "a regular basis" to be at least three times a week.) The data, as summarized in the contingency table below, were classified according to two variables: the age of the respondent ("under 18", "18-35", "36-54", "55+") and regularity of email use ("on a regular basis" or "not on a regular basis"). Each cell of the table contains three numbers: the first number is the observed cell frequency (fO); the second number is the expected cell frequency (fE) under the assumption that there is no dependence between age and regularity of email use and the third number is the following value.To determine a target audience for a new email package, a computer company surveyed a large random sample of potential customers, asking each whether he/she uses email on a regular basis. (The company considered "a regular basis" to be at least three times a week.) The data, as summarized in the contingency table below, were classified according to two variables: the age of the respondent ("under 18", "18-35", "36-54", "55+") and regularity of email use ("on a regular basis" or "not on a regular basis"). Each cell of the table contains three numbers: the first number is the observed cell frequency (fO); the second number is the expected cell frequency (fE) under the assumption that there is no dependence between age and regularity of email use and the third number is the following value. =−fOfE2fE−Observed cell frequencyExpected cell frequency2Expected cell frequencyThe International Business Society conducts a series of managerial surveys to detect challenges that international managers encounter and what strategies help them overcome those challenges. A previous study showed that employee retention is the most critical organizational challenge currently confronted by international managers. One strategy that may impact employee retention is a successful employee recognition program. The International Business Society randomly selected 423 small firms and 192 large firms. The study showed that 326 of the 423 small firms have employee retention programs compared to 167 of the 192 large organizations. At the 0.01 level of significance, is there evidence of a significant difference between small firms and large firms concerning the proportion that has employee recognition program? Find the p-value and interpret its meaning? Construct and interpret a 99% confidence interval estimate for the difference between small firms and large firms…