A survey of adult men and women asked, "Which one of the following jobs would you most like to have?" The results of the survey are shown in the table. (a) Construct a relative frequency distribution for men and women. (b) Construct a side-by-side relative frequency bar graph. (c) What are the apparent differences in gender as it pertains to this question? Job Men Women A 42 17 26 37 C 14 14 12 12 Not sure 20 (a) Complete the table below. Job Men Women A B C Not sure (Round to three decimal places as needed.) (b) Choose the correct graph below. Men Women Men Women 0.41 O A. 0.4- 0.2- В. 0.2- 0- A В Not sure 0- A В Not sure Men Women Men Women 0.4- 0.4- Oc. 0.2- D. 0.2- 0- A B Not sure 0- A Not sure
A survey of adult men and women asked, "Which one of the following jobs would you most like to have?" The results of the survey are shown in the table. (a) Construct a relative frequency distribution for men and women. (b) Construct a side-by-side relative frequency bar graph. (c) What are the apparent differences in gender as it pertains to this question? Job Men Women A 42 17 26 37 C 14 14 12 12 Not sure 20 (a) Complete the table below. Job Men Women A B C Not sure (Round to three decimal places as needed.) (b) Choose the correct graph below. Men Women Men Women 0.41 O A. 0.4- 0.2- В. 0.2- 0- A В Not sure 0- A В Not sure Men Women Men Women 0.4- 0.4- Oc. 0.2- D. 0.2- 0- A B Not sure 0- A Not sure

Glencoe Algebra 1, Student Edition, 9780079039897, 0079039898, 2018
18th Edition
ISBN:9780079039897
Author:Carter
Publisher:Carter
Chapter10: Statistics
Section10.4: Distributions Of Data
Problem 19PFA

Related questions
Question
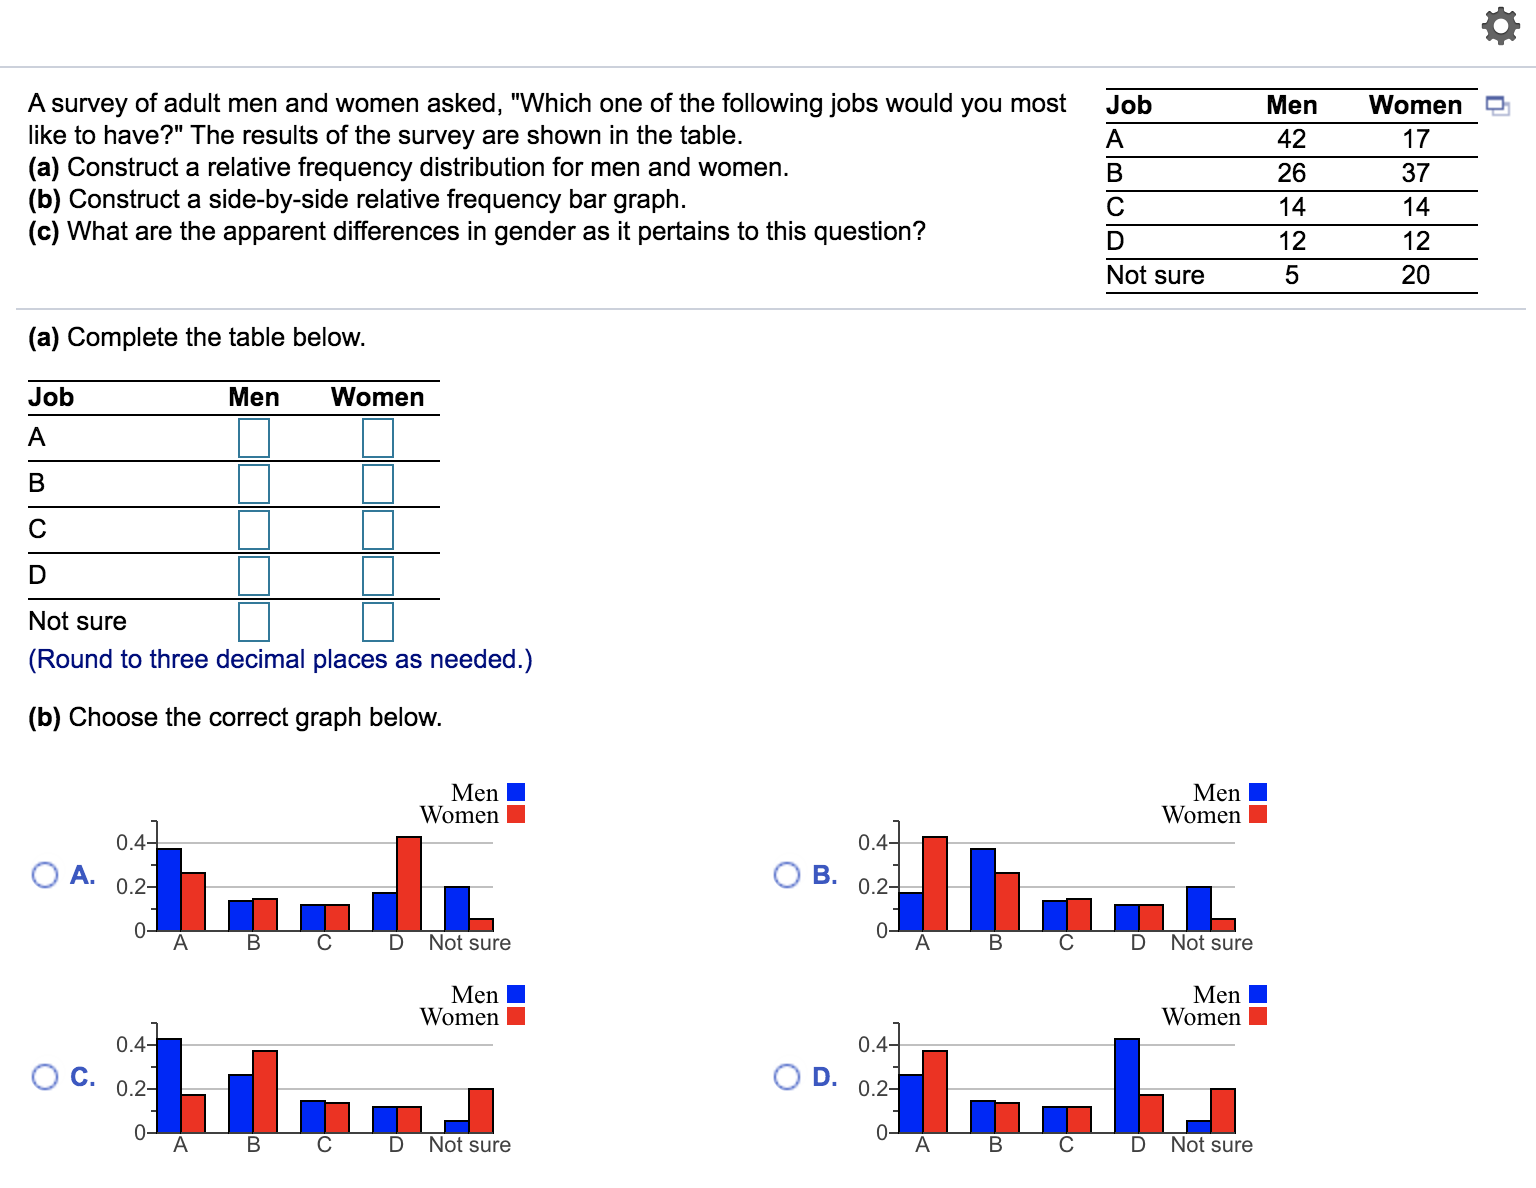
Transcribed Image Text:A survey of adult men and women asked, "Which one of the following jobs would you most
like to have?" The results of the survey are shown in the table.
(a) Construct a relative frequency distribution for men and women.
(b) Construct a side-by-side relative frequency bar graph.
(c) What are the apparent differences in gender as it pertains to this question?
Job
Men
Women
A
42
17
26
37
C
14
14
12
12
Not sure
20
(a) Complete the table below.
Job
Men
Women
A
B
C
Not sure
(Round to three decimal places as needed.)
(b) Choose the correct graph below.
Men
Women
Men
Women
0.41
O A.
0.4-
0.2-
В.
0.2-
0-
A
В
Not sure
0-
A
В
Not sure
Men
Women
Men
Women
0.4-
0.4-
Oc.
0.2-
D.
0.2-
0-
A
B
Not sure
0-
A
Not sure
Expert Solution
This question has been solved!
Explore an expertly crafted, step-by-step solution for a thorough understanding of key concepts.

This is a popular solution!

Trending now
This is a popular solution!

Step by step
Solved in 2 steps with 2 images

Knowledge Booster


Learn more about
Need a deep-dive on the concept behind this application? Look no further. Learn more about this topic, statistics and related others by exploring similar questions and additional content below.Recommended textbooks for you
Glencoe Algebra 1, Student Edition, 9780079039897…
Algebra
ISBN:
9780079039897
Author:
Carter
Publisher:
McGraw Hill
Glencoe Algebra 1, Student Edition, 9780079039897…
Algebra
ISBN:
9780079039897
Author:
Carter
Publisher:
McGraw Hill