A traffic safety company publishes reports about motorcycle fatalities and helmet use. In the first accompanying data table, the distribution shows the proportion of fatalities by location of injury for motorcycle accidents. The second data table shows the location of injury and fatalities for 2057 riders not wearing a helmet. Complete parts (a) and (b) below. Click the icon to view the tables. Click the icon to view the chi-square table of critical values. (a) Does the distribution of fatal injuries for riders not wearing a helmet follow the distribution for all riders? Use a = 0.01 level of significance. What are the null and alternative hypotheses? Ho: The distribution of fatal injuries for riders not wearing a helmet the same distribution for all other riders. H,: The distribution of fatal injuries for riders not wearing a helmet the same distribution for all other riders. Distribution of fatalities by location of injury ITT Compute the expected counts for each fatal injury. Location of injury Observed Count Expected Count Full data set Multiple Locations 1024 Proportion of fatalities by location of injury for motorcycle accidents Head 869 Multiple Abdomen/ Location of injury Head Neck Thorax Neck 39 locations Lumbar/ Spine Thorax 80 Proportion 0.570 0.310 0.030 0.060 0.030 Abdomen/Lumbar/Spine 45 Location of injury and fatalities for 2057 riders not wearing a helmet (Round to two decimal places as needed.) Location of Multiple Abdomen/ Head Neck Thorax What is the test statistic? injury locations Lumbar/ Spine Number 1024 869 39 80 45 (Round to three decimal places as needed.) %D What is the range of P-values for the test? Print Done The range of P-values for the test is Based on the results, does the distribution of fatal injuries for riders not wearing a helmet follow the distribution for all other riders at a significance level of a = 0.01? There sufficient evidence that the distribution of fatal injuries for riders not wearing a helmet the distribution for all riders. (b) Compare the observed and expected counts for each category. What does this information tell you? Motorcycle fatalities from frequently for riders not wearing a helmet, while they occur frequently for all other locations. ОCcur
A traffic safety company publishes reports about motorcycle fatalities and helmet use. In the first accompanying data table, the distribution shows the proportion of fatalities by location of injury for motorcycle accidents. The second data table shows the location of injury and fatalities for 2057 riders not wearing a helmet. Complete parts (a) and (b) below. Click the icon to view the tables. Click the icon to view the chi-square table of critical values. (a) Does the distribution of fatal injuries for riders not wearing a helmet follow the distribution for all riders? Use a = 0.01 level of significance. What are the null and alternative hypotheses? Ho: The distribution of fatal injuries for riders not wearing a helmet the same distribution for all other riders. H,: The distribution of fatal injuries for riders not wearing a helmet the same distribution for all other riders. Distribution of fatalities by location of injury ITT Compute the expected counts for each fatal injury. Location of injury Observed Count Expected Count Full data set Multiple Locations 1024 Proportion of fatalities by location of injury for motorcycle accidents Head 869 Multiple Abdomen/ Location of injury Head Neck Thorax Neck 39 locations Lumbar/ Spine Thorax 80 Proportion 0.570 0.310 0.030 0.060 0.030 Abdomen/Lumbar/Spine 45 Location of injury and fatalities for 2057 riders not wearing a helmet (Round to two decimal places as needed.) Location of Multiple Abdomen/ Head Neck Thorax What is the test statistic? injury locations Lumbar/ Spine Number 1024 869 39 80 45 (Round to three decimal places as needed.) %D What is the range of P-values for the test? Print Done The range of P-values for the test is Based on the results, does the distribution of fatal injuries for riders not wearing a helmet follow the distribution for all other riders at a significance level of a = 0.01? There sufficient evidence that the distribution of fatal injuries for riders not wearing a helmet the distribution for all riders. (b) Compare the observed and expected counts for each category. What does this information tell you? Motorcycle fatalities from frequently for riders not wearing a helmet, while they occur frequently for all other locations. ОCcur

Glencoe Algebra 1, Student Edition, 9780079039897, 0079039898, 2018
18th Edition
ISBN:9780079039897
Author:Carter
Publisher:Carter
Chapter10: Statistics
Section10.4: Distributions Of Data
Problem 22PFA

Related questions
Topic Video
Question
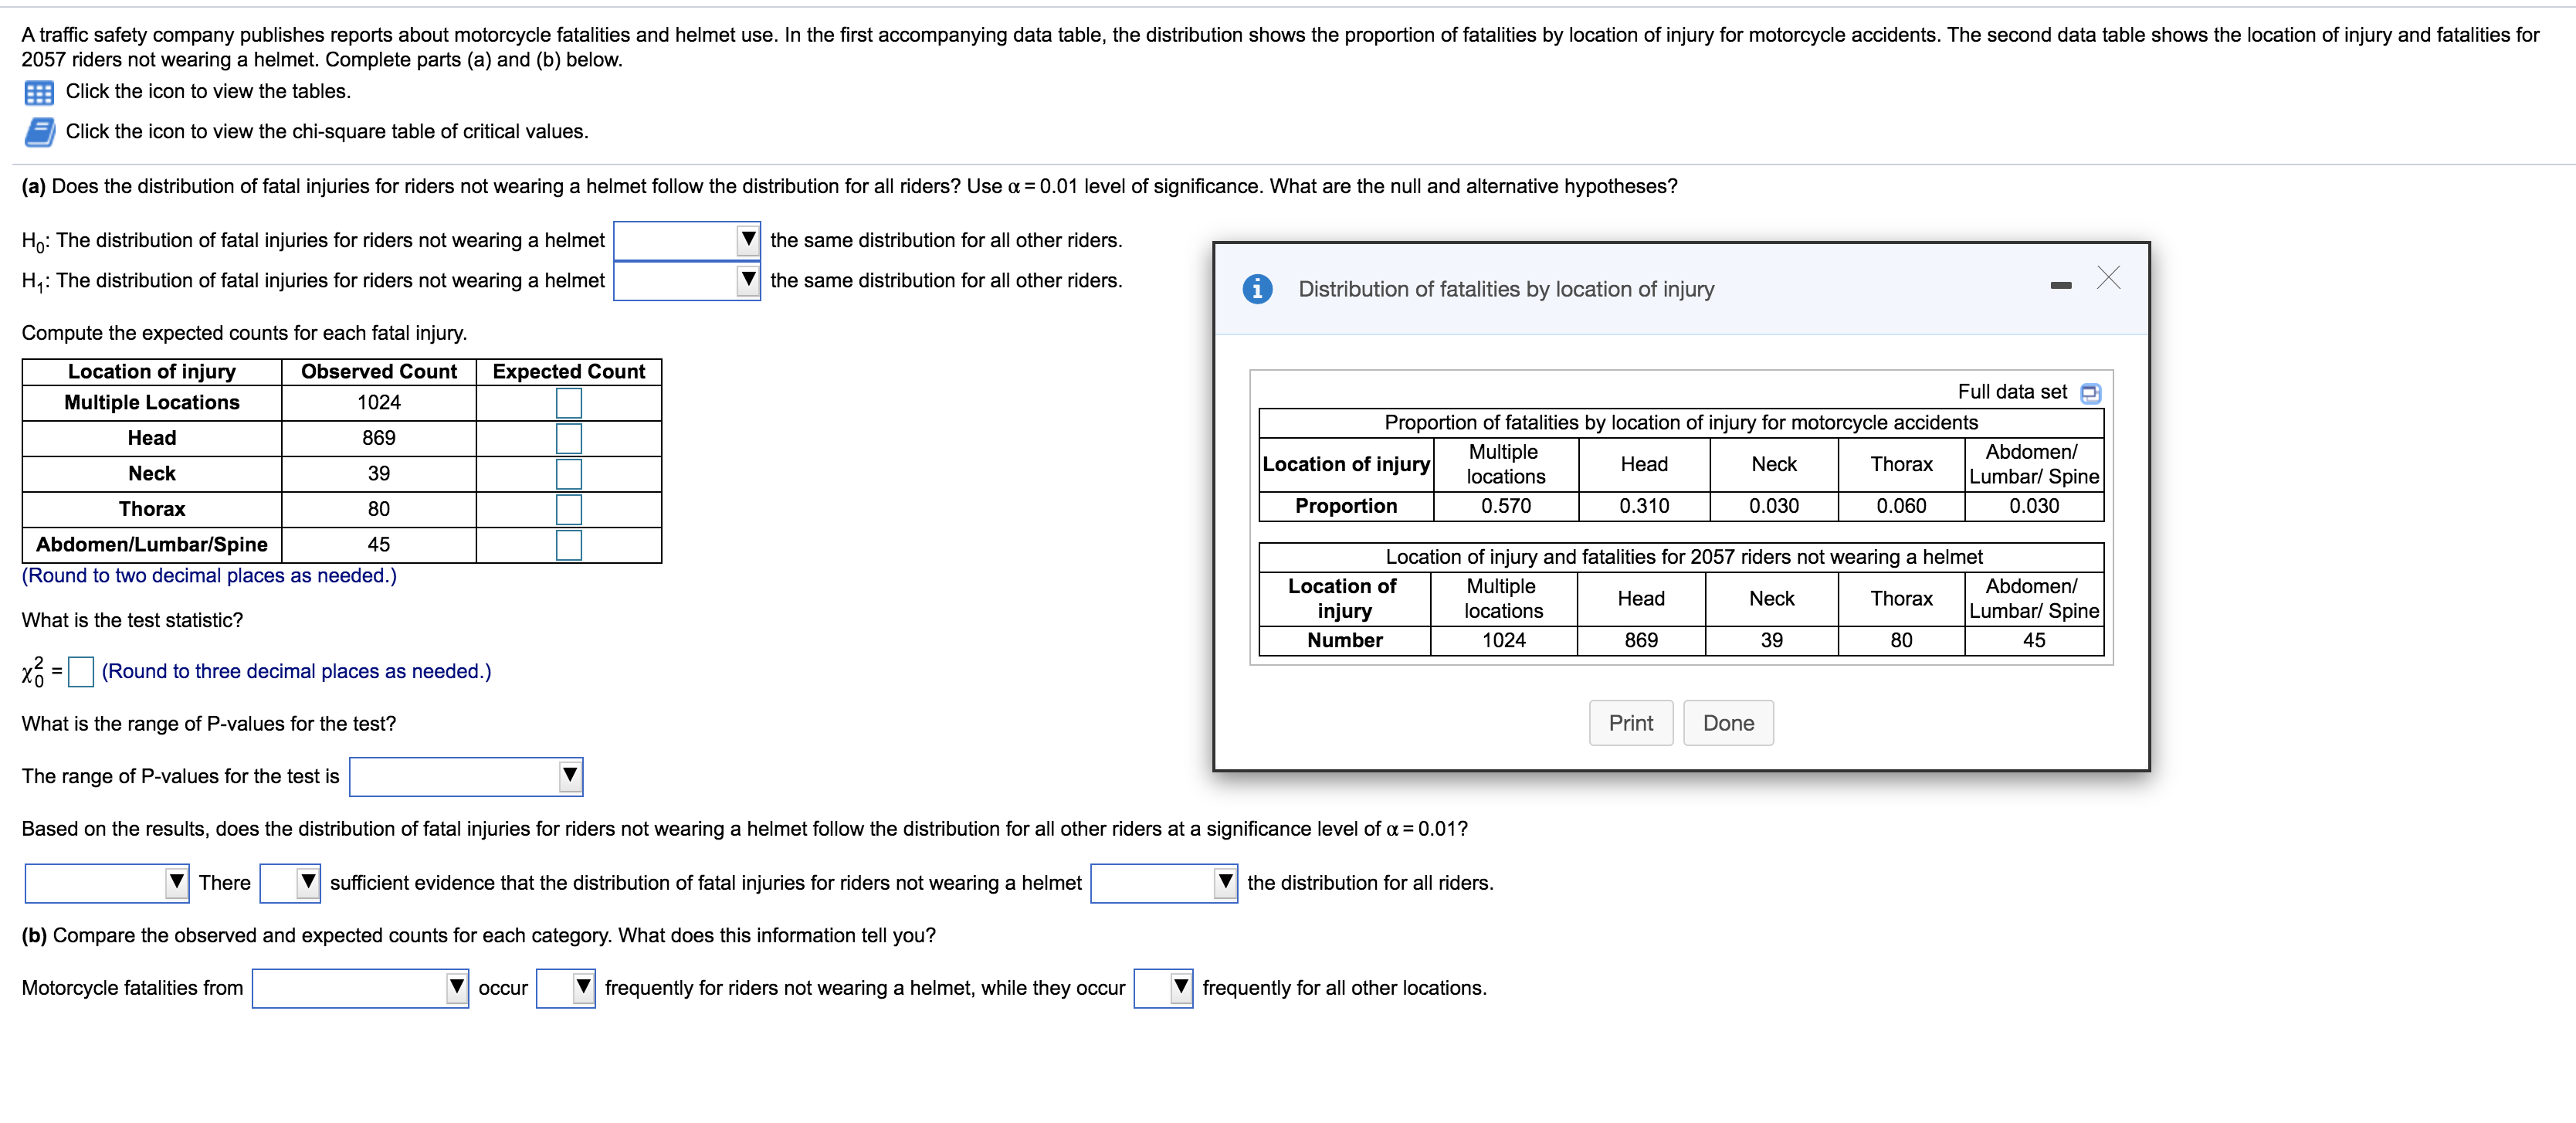
Transcribed Image Text:A traffic safety company publishes reports about motorcycle fatalities and helmet use. In the first accompanying data table, the distribution shows the proportion of fatalities by location of injury for motorcycle accidents. The second data table shows the location of injury and fatalities for
2057 riders not wearing a helmet. Complete parts (a) and (b) below.
Click the icon to view the tables.
Click the icon to view the chi-square table of critical values.
(a) Does the distribution of fatal injuries for riders not wearing a helmet follow the distribution for all riders? Use a = 0.01 level of significance. What are the null and alternative hypotheses?
Ho: The distribution of fatal injuries for riders not wearing a helmet
the same distribution for all other riders.
H,: The distribution of fatal injuries for riders not wearing a helmet
the same distribution for all other riders.
Distribution of fatalities by location of injury
ITT
Compute the expected counts for each fatal injury.
Location of injury
Observed Count
Expected Count
Full data set
Multiple Locations
1024
Proportion of fatalities by location of injury for motorcycle accidents
Head
869
Multiple
Abdomen/
Location of injury
Head
Neck
Thorax
Neck
39
locations
Lumbar/ Spine
Thorax
80
Proportion
0.570
0.310
0.030
0.060
0.030
Abdomen/Lumbar/Spine
45
Location of injury and fatalities for 2057 riders not wearing a helmet
(Round to two decimal places as needed.)
Location of
Multiple
Abdomen/
Head
Neck
Thorax
What is the test statistic?
injury
locations
Lumbar/ Spine
Number
1024
869
39
80
45
(Round to three decimal places as needed.)
%D
What is the range of P-values for the test?
Print
Done
The range of P-values for the test is
Based on the results, does the distribution of fatal injuries for riders not wearing a helmet follow the distribution for all other riders at a significance level of a = 0.01?
There
sufficient evidence that the distribution of fatal injuries for riders not wearing a helmet
the distribution for all riders.
(b) Compare the observed and expected counts for each category. What does this information tell you?
Motorcycle fatalities from
frequently for riders not wearing a helmet, while they occur
frequently for all other locations.
ОCcur
Expert Solution
This question has been solved!
Explore an expertly crafted, step-by-step solution for a thorough understanding of key concepts.

This is a popular solution!

Trending now
This is a popular solution!

Step by step
Solved in 4 steps with 6 images

Knowledge Booster


Learn more about
Need a deep-dive on the concept behind this application? Look no further. Learn more about this topic, statistics and related others by exploring similar questions and additional content below.Recommended textbooks for you
Glencoe Algebra 1, Student Edition, 9780079039897…
Algebra
ISBN:
9780079039897
Author:
Carter
Publisher:
McGraw Hill

College Algebra (MindTap Course List)
Algebra
ISBN:
9781305652231
Author:
R. David Gustafson, Jeff Hughes
Publisher:
Cengage Learning

Big Ideas Math A Bridge To Success Algebra 1: Stu…
Algebra
ISBN:
9781680331141
Author:
HOUGHTON MIFFLIN HARCOURT
Publisher:
Houghton Mifflin Harcourt
Glencoe Algebra 1, Student Edition, 9780079039897…
Algebra
ISBN:
9780079039897
Author:
Carter
Publisher:
McGraw Hill
College Algebra (MindTap Course List)
Algebra
ISBN:
9781305652231
Author:
R. David Gustafson, Jeff Hughes
Publisher:
Cengage Learning
Big Ideas Math A Bridge To Success Algebra 1: Stu…
Algebra
ISBN:
9781680331141
Author:
HOUGHTON MIFFLIN HARCOURT
Publisher:
Houghton Mifflin Harcourt

Holt Mcdougal Larson Pre-algebra: Student Edition…
Algebra
ISBN:
9780547587776
Author:
HOLT MCDOUGAL
Publisher:
HOLT MCDOUGAL