A two-sample z-test for two population proportions is to be performed using the P-value approach. The null hypothesis is H: P, = P2 and the altemative is H: P, * P2. Use the given sample data to find the P-value for the hypothesis test. Give an interpretation of the p-value. A state university found it lost 25 students out of 352 in 2013 and 36 students out of 334 in 2014. O A. P-value = 0.0455; If there is no difference in the proportions, there is about a 4.55% chance of seeing the observed difference or larger by natural sampling variation. O B. P-value = 0.091; If there is no difference in the proportions, there is about a 9.1% chance of seeing the observed difference or larger by natural sampling variation. OC. P-value = 0. 091; There is about a 9.1% chance that the two proportions are equal. O D. P-value = 0. 0455; There is about a 4.55% chance that the two proportions are equal. O E. P-value = 0.9545; If there is no difference in the proportions, there about a 95.45% chance of seeing the observed difference or larger by natural sampling variation.
A two-sample z-test for two population proportions is to be performed using the P-value approach. The null hypothesis is H: P, = P2 and the altemative is H: P, * P2. Use the given sample data to find the P-value for the hypothesis test. Give an interpretation of the p-value. A state university found it lost 25 students out of 352 in 2013 and 36 students out of 334 in 2014. O A. P-value = 0.0455; If there is no difference in the proportions, there is about a 4.55% chance of seeing the observed difference or larger by natural sampling variation. O B. P-value = 0.091; If there is no difference in the proportions, there is about a 9.1% chance of seeing the observed difference or larger by natural sampling variation. OC. P-value = 0. 091; There is about a 9.1% chance that the two proportions are equal. O D. P-value = 0. 0455; There is about a 4.55% chance that the two proportions are equal. O E. P-value = 0.9545; If there is no difference in the proportions, there about a 95.45% chance of seeing the observed difference or larger by natural sampling variation.

Holt Mcdougal Larson Pre-algebra: Student Edition 2012
1st Edition
ISBN:9780547587776
Author:HOLT MCDOUGAL
Publisher:HOLT MCDOUGAL
Chapter11: Data Analysis And Probability
Section: Chapter Questions
Problem 8CR

Related questions
Question
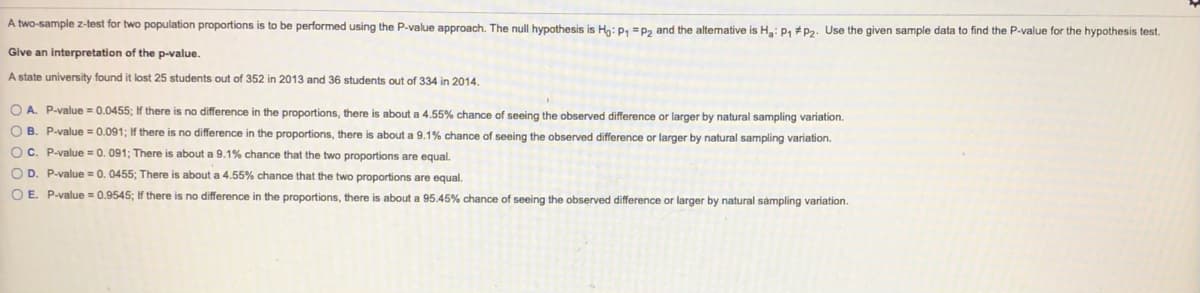
Transcribed Image Text:A two-sample z-test for two population proportions is to be performed using the P-value approach. The null hypothesis is Ho: P, =p, and the altermative is H: P, #P2. Use the given sample data to find the P-value for the hypothesis test.
Give an interpretation of the p-value.
A state university found it lost 25 students out of 352 in 2013 and 36 students out of 334 in 2014.
O A. P-value = 0.0455; If there is no difference in the proportions, there
about a 4.55% chance of seeing the observed difference or larger by natural sampling variation.
O B. P-value = 0.091; If there is no difference in the proportions, there is about a 9.1% chance of seeing the observed difference or larger by natural sampling variation.
OC. P-value = 0. 091; There is about a 9.1% chance that the two proportions are equal.
O D. P-value = 0. 0455; There is about a 4.55% chance that the two proportions are equal.
O E. P-value = 0.9545; If there is no difference in the proportions, there
about a 95.45% chance of seeing the observed difference or larger by natural sampling variation.
Expert Solution
This question has been solved!
Explore an expertly crafted, step-by-step solution for a thorough understanding of key concepts.

This is a popular solution!

Trending now
This is a popular solution!

Step by step
Solved in 2 steps

Knowledge Booster


Learn more about
Need a deep-dive on the concept behind this application? Look no further. Learn more about this topic, statistics and related others by exploring similar questions and additional content below.Recommended textbooks for you
Holt Mcdougal Larson Pre-algebra: Student Edition…
Algebra
ISBN:
9780547587776
Author:
HOLT MCDOUGAL
Publisher:
HOLT MCDOUGAL

College Algebra (MindTap Course List)
Algebra
ISBN:
9781305652231
Author:
R. David Gustafson, Jeff Hughes
Publisher:
Cengage Learning
Holt Mcdougal Larson Pre-algebra: Student Edition…
Algebra
ISBN:
9780547587776
Author:
HOLT MCDOUGAL
Publisher:
HOLT MCDOUGAL
College Algebra (MindTap Course List)
Algebra
ISBN:
9781305652231
Author:
R. David Gustafson, Jeff Hughes
Publisher:
Cengage Learning