A two-sample z-test for two population proportions is to be performed using the P-value approach. The null hypothesis is Ho: P, =p, and the altemative is H: P, p2. Use the given sample data to find the P-value for the hypothesis test. Give an Interpretation of the p-value. A state university found it lost 25 students out of 352 in 2013 and 36 students out of 334 in 2014. O A. P-value = 0. 0455; There is about a 4.55% chance that the two proportions are equal. O B. P-value = 0.091; If there is no difference in the proportions, there is about a 9.1% chance of seeing the observed difference or larger by natural sampling variation. OC. P-value = 0.0455; f there is no difference in the proportions, there is about a 4.55% chance of seeing the observed difference or larger by natural sampling variation. O D. P-value -0. 091; There is about a 9.1% chance that the two proportions are equal. OE. P-value = 0.9545; If there is no difference in the proportions, there is about a 95.45% chance of seeing the observed difference or larger by natural sampling variation.
A two-sample z-test for two population proportions is to be performed using the P-value approach. The null hypothesis is Ho: P, =p, and the altemative is H: P, p2. Use the given sample data to find the P-value for the hypothesis test. Give an Interpretation of the p-value. A state university found it lost 25 students out of 352 in 2013 and 36 students out of 334 in 2014. O A. P-value = 0. 0455; There is about a 4.55% chance that the two proportions are equal. O B. P-value = 0.091; If there is no difference in the proportions, there is about a 9.1% chance of seeing the observed difference or larger by natural sampling variation. OC. P-value = 0.0455; f there is no difference in the proportions, there is about a 4.55% chance of seeing the observed difference or larger by natural sampling variation. O D. P-value -0. 091; There is about a 9.1% chance that the two proportions are equal. OE. P-value = 0.9545; If there is no difference in the proportions, there is about a 95.45% chance of seeing the observed difference or larger by natural sampling variation.

MATLAB: An Introduction with Applications
6th Edition
ISBN:9781119256830
Author:Amos Gilat
Publisher:Amos Gilat
Chapter1: Starting With Matlab
Section: Chapter Questions
Problem 1P

Related questions
Question
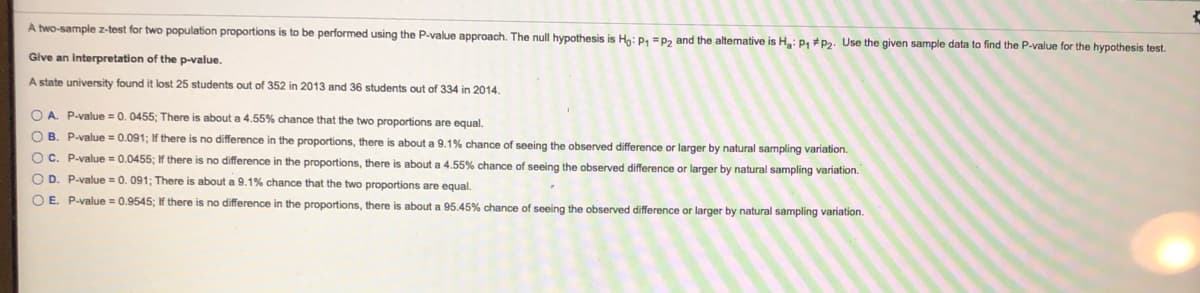
Transcribed Image Text:A two-sample z-test for two population proportions is to be performed using the P-value approach. The null hypothesis is Hn: P, = p, and the altemative is H: P, #p2. Use the given sample data to find the P-value for the hypothesis test.
Give an Interpretation of the p-value.
A state university found it lost 25 students out of 352 in 2013 and 36 students out of 334 in 2014.
O A P-value = 0. 0455; There is about a 4.55% chance that the two proportions are equal.
O B. P-value = 0.091; If there is no difference in the proportions, there is about a 9.1% chance of seeing the observed difference or larger by natural sampling variation.
OC. P-value = 0.0455;
there is no difference in the proportions, there is about a 4.55% chance of seeing the observed difference or larger by natural sampling variation.
O D. P-value = 0. 091; There is about a 9.1% chance that the two proportions are equal.
O E. P-value = 0.9545:
there is no difference in the proportions, there is about a 95.45% chance of seeing the observed difference or larger by natural sampling variation.
Expert Solution
This question has been solved!
Explore an expertly crafted, step-by-step solution for a thorough understanding of key concepts.

This is a popular solution!

Trending now
This is a popular solution!

Step by step
Solved in 2 steps

Knowledge Booster


Learn more about
Need a deep-dive on the concept behind this application? Look no further. Learn more about this topic, statistics and related others by exploring similar questions and additional content below.Recommended textbooks for you
MATLAB: An Introduction with Applications
Statistics
ISBN:
9781119256830
Author:
Amos Gilat
Publisher:
John Wiley & Sons Inc

Probability and Statistics for Engineering and th…
Statistics
ISBN:
9781305251809
Author:
Jay L. Devore
Publisher:
Cengage Learning

Statistics for The Behavioral Sciences (MindTap C…
Statistics
ISBN:
9781305504912
Author:
Frederick J Gravetter, Larry B. Wallnau
Publisher:
Cengage Learning
MATLAB: An Introduction with Applications
Statistics
ISBN:
9781119256830
Author:
Amos Gilat
Publisher:
John Wiley & Sons Inc
Probability and Statistics for Engineering and th…
Statistics
ISBN:
9781305251809
Author:
Jay L. Devore
Publisher:
Cengage Learning
Statistics for The Behavioral Sciences (MindTap C…
Statistics
ISBN:
9781305504912
Author:
Frederick J Gravetter, Larry B. Wallnau
Publisher:
Cengage Learning

Elementary Statistics: Picturing the World (7th E…
Statistics
ISBN:
9780134683416
Author:
Ron Larson, Betsy Farber
Publisher:
PEARSON

The Basic Practice of Statistics
Statistics
ISBN:
9781319042578
Author:
David S. Moore, William I. Notz, Michael A. Fligner
Publisher:
W. H. Freeman

Introduction to the Practice of Statistics
Statistics
ISBN:
9781319013387
Author:
David S. Moore, George P. McCabe, Bruce A. Craig
Publisher:
W. H. Freeman