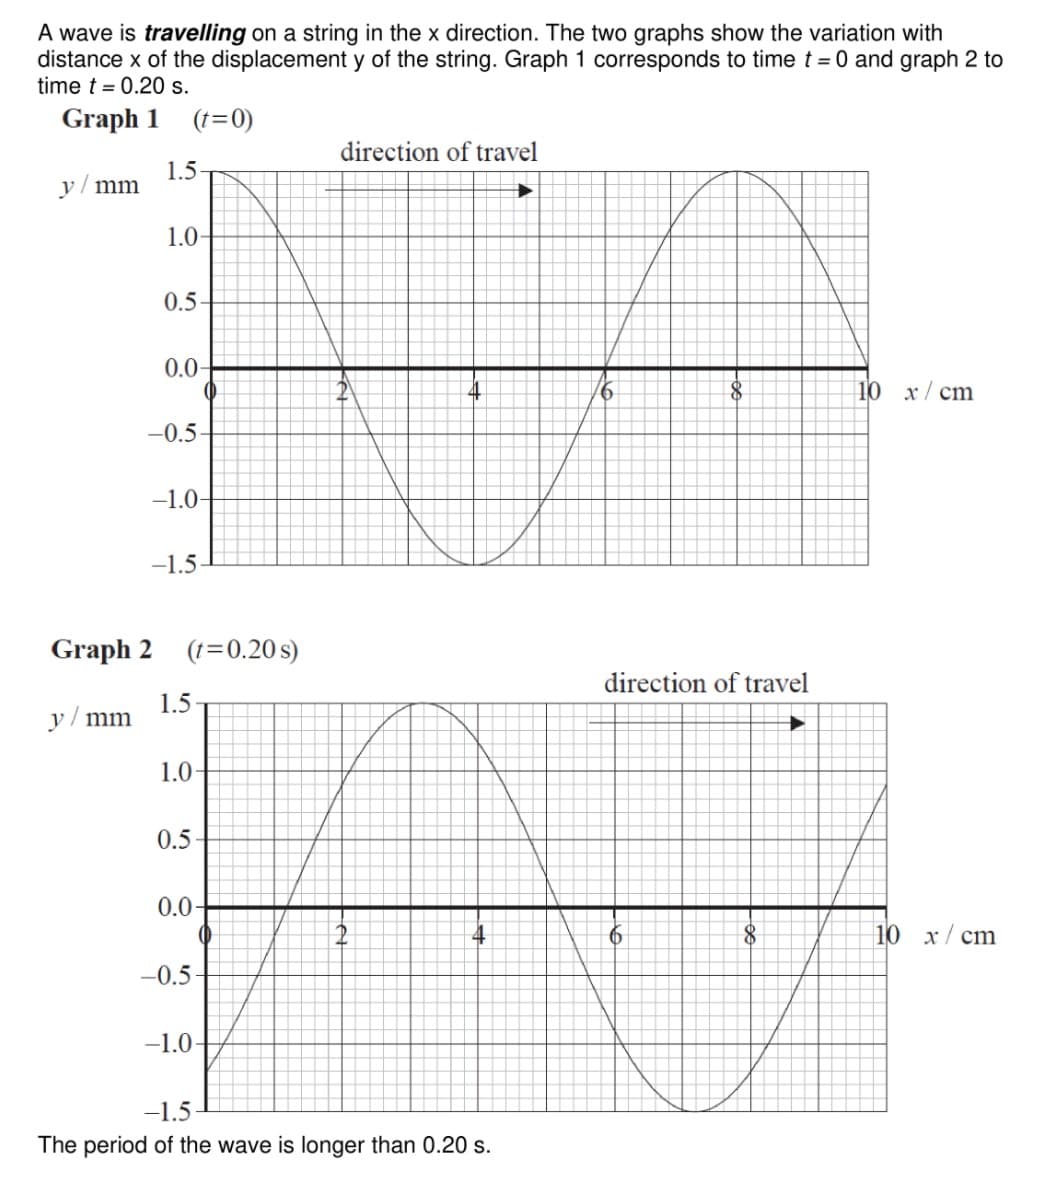
A wave is travelling on a string in the x direction. The two graphs show the variation with distance x of the displacement y of the string. Graph 1 corresponds to time t = 0 and graph 2 to time t = 0.20 s. Graph 1 (t=0) direction of travel 1.5- y/ mm 1.0- 0.5- 0.0- |10 x/ cm -0.5 -1.0- -1.5- Graph 2 (1=0.20 s) direction of travel 1.5 y / mm 1.0- 0.5 0.0- 10 x/ cm -0.5 -1.0- -1.5 The period of the wave is longer than 0.20 s.
A wave is travelling on a string in the x direction. The two graphs show the variation with distance x of the displacement y of the string. Graph 1 corresponds to time t = 0 and graph 2 to time t = 0.20 s. Graph 1 (t=0) direction of travel 1.5- y/ mm 1.0- 0.5- 0.0- |10 x/ cm -0.5 -1.0- -1.5- Graph 2 (1=0.20 s) direction of travel 1.5 y / mm 1.0- 0.5 0.0- 10 x/ cm -0.5 -1.0- -1.5 The period of the wave is longer than 0.20 s.

Related questions
Question
Using the attached graphs depicting a wave, find the:
a. amplitude
b. frequency
c. speed
Transcribed Image Text:A wave is travelling on a string in the x direction. The two graphs show the variation with
distance x of the displacement y of the string. Graph 1 corresponds to time t =0 and graph 2 to
time t = 0.20 s.
Graph 1 (t=0)
direction of travel
1.5
y/ mm
1.0-
0.5-
0.0
10 x/ cm
-0.5
-1.0-
-1.5
Graph 2
(t=0.20 s)
direction of travel
1.5
y/ mm
1.0-
0.5
0.0-
10 x/ cm
-0.5
-1.0-
-1.5
The period of the wave is longer than 0.20 s.
Expert Solution
This question has been solved!
Explore an expertly crafted, step-by-step solution for a thorough understanding of key concepts.

This is a popular solution!

Trending now
This is a popular solution!

Step by step
Solved in 5 steps with 3 images
