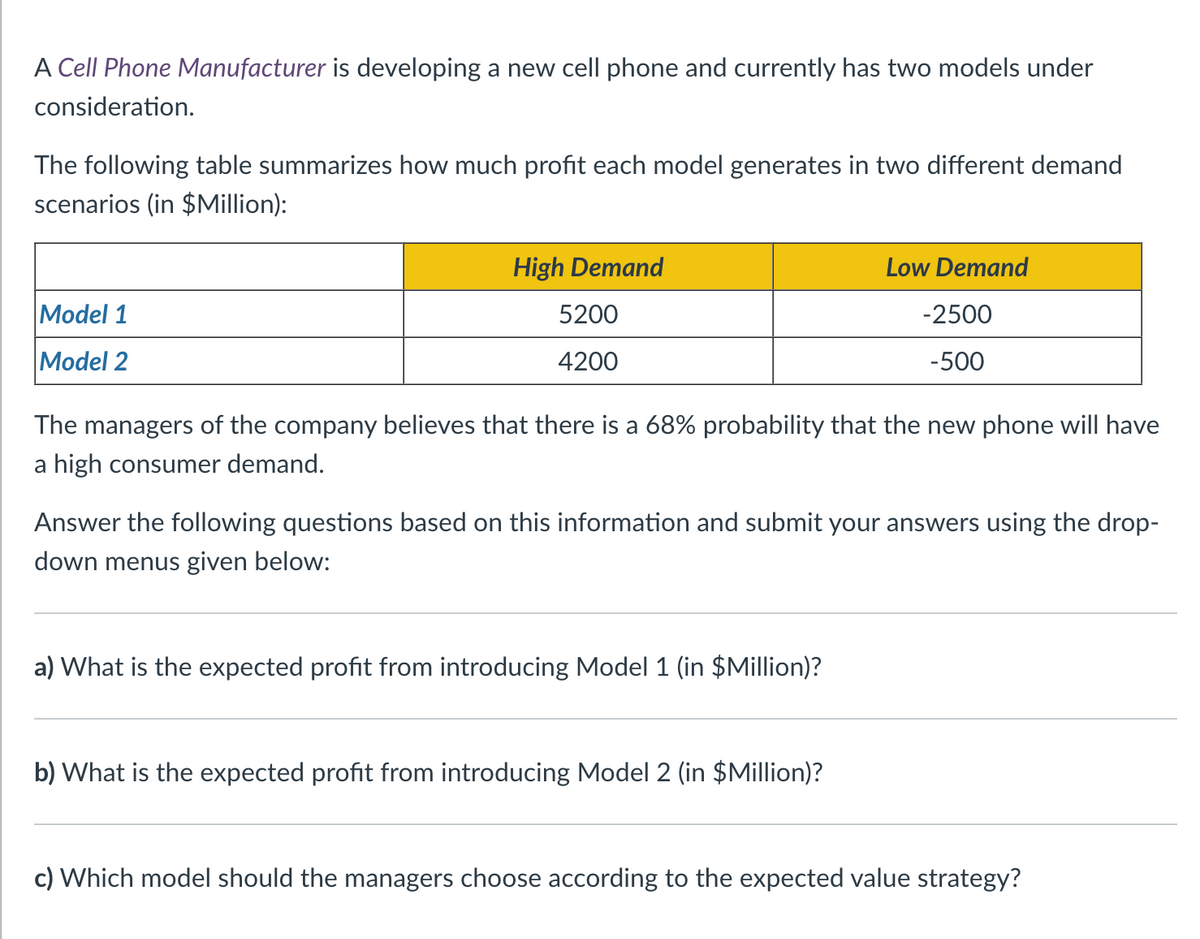
a) What is the expected profit from introducing Model 1 (in $Million)? b) What is the expected profit from introducing Model 2 (in $Million)? c) Which model should the managers choose according to the expected value strategy?


Q: Three suppliers A, B and C, each produce road grit which has to be delivered to council depots W, X,…
A: Find the Given details below: Given details: Depot W Depot X Depot Y Depot Z Stock…
Q: Describe for Local and Global perspective Apple Inc and details
A: Apple Inc. is multinational technology company known for its innovative products & services. It…
Q: EXPLAIN THE PRINCIPLES OF PERFORMANCE MANAGEMENT
A: Performance management is a process that involves establishing clear expectations, providing…
Q: Sandwich chain Eggslut opens at Scotts Square Famed Los Angeles egg sandwich chain Eggslut is…
A: Eggslut, a well-known sandwich restaurant established in Los Angeles famed for its egg-centric…
Q: Principles of Procurement and Logistics Management Qn.1. In around two (2) pages demonstrate…
A: Supplier evaluation is a process of estimating and consenting possible suppliers through…
Q: Lillian Fok is president of Lakefront Manufacturing, a producer of bicycle tires. Fok makes 1,200…
A: Find the Given details below: Given details: Production 1200 tires per day Labor 425 hours…
Q: What is the role of documentation in project management?what are the key phrases in project…
A: Documentation plays crucial role in project management as it serves as a record of project…
Q: this question is procurement and logistic management related but you don,t have the subject in your…
A: Many organisations that want to improve their competitiveness and profitability set a strategic goal…
Q: 3.1Identify five common underlying causes of resistance to change. 3.2Explain how you can…
A: 1) Fear of the unknown = People has a fear because they are unsure of how a change would affect…
Q: What distinguishes transform mapping from system images as methods of system analysis and design?
A: An interdisciplinary area of research called system design and analysis studies a system by looking…
Q: What is the overall duration of the project (in weeks)? 28 weeks What is the earliest week you could…
A: As per Bartleby guidelines, we can only solve the first three subparts of one question at a…
Q: List and explain the attributes of Project quality Management
A: Project Quality Management is a vital component of project management that focuses on ensuring that…
Q: For the Following periods, based on the information in the table. How would you describe the current…
A: Here, based on each period's data, we could state the current status of this project to the…
Q: Please complete all work in excel. Use excel to make the calculations (cells can be clicked on to…
A: EVPI is a concept that is used by the business manager while taking important decisions and is…
Q: An office security system at PAC Ltd has two component parts, both of which must work for the…
A: System reliability can be calculated by identifying the systme model whether its a serial model or…
Q: discuss importance of project resource planning and its impact on project success
A: Project resource planning which requires efficiently identifying, procuring and utilizing the…
Q: At what point does a system reach a state of impasse where further advancement becomes unattainable,…
A: Development is impossible in an impasse, especially when there is disagreement. It denotes a…
Q: critically discuss the role of the Board of Directors and Senior Management in Achieving Effective…
A: Today's enterprises confront a wide variety of threats. In the past, organizations dealt with their…
Q: Firm B's demand for a product is 10 units per month. Its supplier charges an ordering cost of $5 per…
A: Find the Calculation methods below: EOQ (Q) = 2DSHTotal cost = (D * h) + ((DQ)*S) + (Q2)*HD - Annual…
Q: explain , How can organizations develop and evaluate strategic alternatives
A: Strategic alternatives are various paths of action that an organization could at some time choose.…
Q: QUESTION NINE Jack, the owner and manager of Jack's Box Company, wants to monitor usage at Work…
A: The following information is provided to us:
Q: RISK MANAGEMENT IN PURCHASING/PROCUREMENT CASE STUDY A survey by Capgemini Research Institute…
A: Risk management is the process of identifying the risk and transferring those risks that can impact…
Q: New Assignment R4 0.85 ✓ [0-94] R2 101947—10.97] 0.941 R5 0961 HOPP ↓ 0.96 R6 0.98 10.98 Find the…
A: Reliability is the ability to be trustworthy and consistent throughout the process.
Q: this question is procurement and logistic management related but you don,t have the subject in your…
A: The goal of cost leadership is to reduce both operating expenses and the service or goods' prices.…
Q: How can organizations effectively incorporate qualitative and quantitative forecasting techniques in…
A: Qualitative and quantitative forecasting are two distinct approaches used to predict future…
Q: Consider the below excerpt of a spend analysis conducted by Toyota South Africa regarding their raw…
A: Supplier Category: Raw materials Total spend per supplier Auto Parts SA ZAR 40,000,000…
Q: Why do many small firms use job production? Explain one advantage and one disadvantage that batch…
A: Two typical manufacturing techniques in small businesses are batch production and job production.…
Q: The Andrews family is in the process of hiring a five-star chef who can cook a variety of food to…
A: In this case, we have two restaurants with opposing demands and goals. The Andrews family restaurant…
Q: (Please do not give solution in image format thanku) while our financial loss is serious, most of…
A: Human resource management is the management of employees working in the organization. The work of a…
Q: Does American Eagle OUtfitters have any intangibles?
A: A specialty retailer of casual clothing, accessories, outerwear, and footwear for both men and…
Q: How can a well-designed CRM system facilitate effective collaboration and communication among…
A: Organizations understand the need for efficient departmental collaboration and communication in…
Q: A brokerage firm is considering investment options for its clients. If the market is good the…
A: Find the Given details below: Given details: Market Fund A Fund B Fund C Good $…
Q: The Importance of Clarity and Conciseness
A: Clarity and conciseness are key qualities of good communication that are extremely important in a…
Q: How can optimization models be effectively applied in management decision-making processes to…
A: Decision-making is the process of choosing between alternative options based on a set of criteria,…
Q: There are several factors influencing warehouse operations. Advise Takealot on the importance of…
A: The management of a business's whole supply chain depends heavily on warehouse operations. When…
Q: The Fearless Champions Outdoor Company is a catalogue sales operation that specializes in outdoor…
A: Find the Given details below: Given details: Quarter Year 1 2 3 1 38 33 40 2 34 36 45…
Q: A company wants to locate a new warehouse to minimize the longest distance traveled by any of its…
A: Non-linear programming deals with the optimization of an objective function subject to constraints…
Q: a) Based on the activity time estimates, the expected times and variance for each of the activities…
A: As per Bartleby guidelines, we can only solve the first three subparts of one question at a…
Q: . Think about your own approach to problem-solving. Do you rate values or objective data more…
A: When it comes to problem-solving, finding a happy medium between values and objective evidence is…
Q: Diagrammatically represent the Talent Management process for Dynamic Technologies
A: Organisations that want to attract, develop, and retain great personnel must invest in talent…
Q: Why is Lyft cheap than Uber? Explain
A: Lyft is often perceived as cheaper than Uber due to various factors. Below are few of those factors:
Q: How can optimization models be effectively utilized in supply chain management to maximize…
A: Each business should carefully examine their supply chain activities in order to maximize efficiency…
Q: 3. Solve the following transportation problem by UV method. 15 25 O 2 10 7 -% 9 3)-15 -12 5)-13
A: Find the given details below:
Q: evaluating strategies on a continuous rather than a periodic base is desired?
A: In today's dynamic and rapidly changing business environment, evaluating strategies on a continuous…
Q: discuss importance of project resource planning and its impact on project success
A: Project success depends on the effective identification, acquisition, and utilization of the…
Q: How many machines of each class must the company purchase to reach its target
A: Here, first, I would formulate the LP, Decision variables: The number of machines A=X1 The number…
Q: What are the disavantages of quality management software (QMS)?
A: A technological solution called quality management software (QMS) helps businesses monitor and…
Q: The Director of medical services predicted six years ago that demand in year 1 would be 84…
A: Exponential smoothing is a time series forecasting technique that is widely used for making…
Q: Explain the concept of contingent workforce and discuss the benefits and challenges of utilizing…
A: The utilization of a contingent workforce, comprising temporary, contract, and freelance workers,…
Q: What is considered are the most important M in the Four M’s of Operation?
A: The Four M's are a term used in operations management to describe the four primary resources that…
Operations Management

Step by step
Solved in 4 steps

- Based on Babich (1992). Suppose that each week each of 300 families buys a gallon of orange juice from company A, B, or C. Let pA denote the probability that a gallon produced by company A is of unsatisfactory quality, and define pB and pC similarly for companies B and C. If the last gallon of juice purchased by a family is satisfactory, the next week they will purchase a gallon of juice from the same company. If the last gallon of juice purchased by a family is not satisfactory, the family will purchase a gallon from a competitor. Consider a week in which A families have purchased juice A, B families have purchased juice B, and C families have purchased juice C. Assume that families that switch brands during a period are allocated to the remaining brands in a manner that is proportional to the current market shares of the other brands. For example, if a customer switches from brand A, there is probability B/(B + C) that he will switch to brand B and probability C/(B + C) that he will switch to brand C. Suppose that the market is currently divided equally: 10,000 families for each of the three brands. a. After a year, what will the market share for each firm be? Assume pA = 0.10, pB = 0.15, and pC = 0.20. (Hint: You will need to use the RISKBINOMLAL function to see how many people switch from A and then use the RISKBENOMIAL function again to see how many switch from A to B and from A to C. However, if your model requires more RISKBINOMIAL functions than the number allowed in the academic version of @RISK, remember that you can instead use the BENOM.INV (or the old CRITBENOM) function to generate binomially distributed random numbers. This takes the form =BINOM.INV (ntrials, psuccess, RAND()).) b. Suppose a 1% increase in market share is worth 10,000 per week to company A. Company A believes that for a cost of 1 million per year it can cut the percentage of unsatisfactory juice cartons in half. Is this worthwhile? (Use the same values of pA, pB, and pC as in part a.)Play Things is developing a new Lady Gaga doll. The company has made the following assumptions: The doll will sell for a random number of years from 1 to 10. Each of these 10 possibilities is equally likely. At the beginning of year 1, the potential market for the doll is two million. The potential market grows by an average of 4% per year. The company is 95% sure that the growth in the potential market during any year will be between 2.5% and 5.5%. It uses a normal distribution to model this. The company believes its share of the potential market during year 1 will be at worst 30%, most likely 50%, and at best 60%. It uses a triangular distribution to model this. The variable cost of producing a doll during year 1 has a triangular distribution with parameters 15, 17, and 20. The current selling price is 45. Each year, the variable cost of producing the doll will increase by an amount that is triangularly distributed with parameters 2.5%, 3%, and 3.5%. You can assume that once this change is generated, it will be the same for each year. You can also assume that the company will change its selling price by the same percentage each year. The fixed cost of developing the doll (which is incurred right away, at time 0) has a triangular distribution with parameters 5 million, 7.5 million, and 12 million. Right now there is one competitor in the market. During each year that begins with four or fewer competitors, there is a 25% chance that a new competitor will enter the market. Year t sales (for t 1) are determined as follows. Suppose that at the end of year t 1, n competitors are present (including Play Things). Then during year t, a fraction 0.9 0.1n of the company's loyal customers (last year's purchasers) will buy a doll from Play Things this year, and a fraction 0.2 0.04n of customers currently in the market ho did not purchase a doll last year will purchase a doll from Play Things this year. Adding these two provides the mean sales for this year. Then the actual sales this year is normally distributed with this mean and standard deviation equal to 7.5% of the mean. a. Use @RISK to estimate the expected NPV of this project. b. Use the percentiles in @ RISKs output to find an interval such that you are 95% certain that the companys actual NPV will be within this interval.Based on Grossman and Hart (1983). A salesperson for Fuller Brush has three options: (1) quit, (2) put forth a low level of effort, or (3) put forth a high level of effort. Suppose for simplicity that each salesperson will sell 0, 5000, or 50,000 worth of brushes. The probability of each sales amount depends on the effort level as described in the file P07_71.xlsx. If a salesperson is paid w dollars, he or she regards this as a benefit of w1/2 units. In addition, low effort costs the salesperson 0 benefit units, whereas high effort costs 50 benefit units. If a salesperson were to quit Fuller and work elsewhere, he or she could earn a benefit of 20 units. Fuller wants all salespeople to put forth a high level of effort. The question is how to minimize the cost of encouraging them to do so. The company cannot observe the level of effort put forth by a salesperson, but it can observe the size of his or her sales. Thus, the wage paid to the salesperson is completely determined by the size of the sale. This means that Fuller must determine w0, the wage paid for sales of 0; w5000, the wage paid for sales of 5000; and w50,000, the wage paid for sales of 50,000. These wages must be set so that the salespeople value the expected benefit from high effort more than quitting and more than low effort. Determine how to minimize the expected cost of ensuring that all salespeople put forth high effort. (This problem is an example of agency theory.)
- Suppose you have invested 25% of your portfolio in four different stocks. The mean and standard deviation of the annual return on each stock are shown in the file P11_46.xlsx. The correlations between the annual returns on the four stocks are also shown in this file. a. What is the probability that your portfolios annual return will exceed 30%? b. What is the probability that your portfolio will lose money during the year?The annual demand for Prizdol, a prescription drug manufactured and marketed by the NuFeel Company, is normally distributed with mean 50,000 and standard deviation 12,000. Assume that demand during each of the next 10 years is an independent random number from this distribution. NuFeel needs to determine how large a Prizdol plant to build to maximize its expected profit over the next 10 years. If the company builds a plant that can produce x units of Prizdol per year, it will cost 16 for each of these x units. NuFeel will produce only the amount demanded each year, and each unit of Prizdol produced will sell for 3.70. Each unit of Prizdol produced incurs a variable production cost of 0.20. It costs 0.40 per year to operate a unit of capacity. a. Among the capacity levels of 30,000, 35,000, 40,000, 45,000, 50,000, 55,000, and 60,000 units per year, which level maximizes expected profit? Use simulation to answer this question. b. Using the capacity from your answer to part a, NuFeel can be 95% certain that actual profit for the 10-year period will be between what two values?Software development is an inherently risky and uncertain process. For example, there are many examples of software that couldnt be finished by the scheduled release datebugs still remained and features werent ready. (Many people believe this was the case with Office 2007.) How might you simulate the development of a software product? What random inputs would be required? Which outputs would be of interest? Which measures of the probability distributions of these outputs would be most important?
- In August of the current year, a car dealer is trying to determine how many cars of the next model year to order. Each car ordered in August costs 20,000. The demand for the dealers next year models has the probability distribution shown in the file P10_12.xlsx. Each car sells for 25,000. If demand for next years cars exceeds the number of cars ordered in August, the dealer must reorder at a cost of 22,000 per car. Excess cars can be disposed of at 17,000 per car. Use simulation to determine how many cars to order in August. For your optimal order quantity, find a 95% confidence interval for the expected profit.Suppose that GLC earns a 2000 profit each time a person buys a car. We want to determine how the expected profit earned from a customer depends on the quality of GLCs cars. We assume a typical customer will purchase 10 cars during her lifetime. She will purchase a car now (year 1) and then purchase a car every five yearsduring year 6, year 11, and so on. For simplicity, we assume that Hundo is GLCs only competitor. We also assume that if the consumer is satisfied with the car she purchases, she will buy her next car from the same company, but if she is not satisfied, she will buy her next car from the other company. Hundo produces cars that satisfy 80% of its customers. Currently, GLC produces cars that also satisfy 80% of its customers. Consider a customer whose first car is a GLC car. If profits are discounted at 10% annually, use simulation to estimate the value of this customer to GLC. Also estimate the value of a customer to GLC if it can raise its customer satisfaction rating to 85%, to 90%, or to 95%. You can interpret the satisfaction value as the probability that a customer will not switch companies.A common decision is whether a company should buy equipment and produce a product in house or outsource production to another company. If sales volume is high enough, then by producing in house, the savings on unit costs will cover the fixed cost of the equipment. Suppose a company must make such a decision for a four-year time horizon, given the following data. Use simulation to estimate the probability that producing in house is better than outsourcing. If the company outsources production, it will have to purchase the product from the manufacturer for 25 per unit. This unit cost will remain constant for the next four years. The company will sell the product for 42 per unit. This price will remain constant for the next four years. If the company produces the product in house, it must buy a 500,000 machine that is depreciated on a straight-line basis over four years, and its cost of production will be 9 per unit. This unit cost will remain constant for the next four years. The demand in year 1 has a worst case of 10,000 units, a most likely case of 14,000 units, and a best case of 16,000 units. The average annual growth in demand for years 2-4 has a worst case of 7%, a most likely case of 15%, and a best case of 20%. Whatever this annual growth is, it will be the same in each of the years. The tax rate is 35%. Cash flows are discounted at 8% per year.
- W. L. Brown, a direct marketer of womens clothing, must determine how many telephone operators to schedule during each part of the day. W. L. Brown estimates that the number of phone calls received each hour of a typical eight-hour shift can be described by the probability distribution in the file P10_33.xlsx. Each operator can handle 15 calls per hour and costs the company 20 per hour. Each phone call that is not handled is assumed to cost the company 6 in lost profit. Considering the options of employing 6, 8, 10, 12, 14, or 16 operators, use simulation to determine the number of operators that minimizes the expected hourly cost (labor costs plus lost profits).Although the normal distribution is a reasonable input distribution in many situations, it does have two potential drawbacks: (1) it allows negative values, even though they may be extremely improbable, and (2) it is a symmetric distribution. Many situations are modelled better with a distribution that allows only positive values and is skewed to the right. Two of these that have been used in many real applications are the gamma and lognormal distributions. @RISK enables you to generate observations from each of these distributions. The @RISK function for the gamma distribution is RISKGAMMA, and it takes two arguments, as in =RISKGAMMA(3,10). The first argument, which must be positive, determines the shape. The smaller it is, the more skewed the distribution is to the right; the larger it is, the more symmetric the distribution is. The second argument determines the scale, in the sense that the product of it and the first argument equals the mean of the distribution. (The mean in this example is 30.) Also, the product of the second argument and the square root of the first argument is the standard deviation of the distribution. (In this example, it is 3(10=17.32.) The @RISK function for the lognormal distribution is RISKLOGNORM. It has two arguments, as in =RISKLOGNORM(40,10). These arguments are the mean and standard deviation of the distribution. Rework Example 10.2 for the following demand distributions. Do the simulated outputs have any different qualitative properties with these skewed distributions than with the triangular distribution used in the example? a. Gamma distribution with parameters 2 and 85 b. Gamma distribution with parameters 5 and 35 c. Lognormal distribution with mean 170 and standard deviation 60The eTech Company is a fairly recent entry in the electronic device area. The company competes with Apple. Samsung, and other well-known companies in the manufacturing and sales of personal handheld devices. Although eTech recognizes that it is a niche player and will likely remain so in the foreseeable future, it is trying to increase its current small market share in this huge competitive market. Jim Simons, VP of Production, and Catherine Dolans, VP of Marketing, have been discussing the possible addition of a new product to the companys current (rather limited) product line. The tentative name for this new product is ePlayerX. Jim and Catherine agree that the ePlayerX, which will feature a sleeker design and more memory, is necessary to compete successfully with the big boys, but they are also worried that the ePlayerX could cannibalize sales of their existing productsand that it could even detract from their bottom line. They must eventually decide how much to spend to develop and manufacture the ePlayerX and how aggressively to market it. Depending on these decisions, they must forecast demand for the ePlayerX, as well as sales for their existing products. They also realize that Apple. Samsung, and the other big players are not standing still. These competitors could introduce their own new products, which could have very negative effects on demand for the ePlayerX. The expected timeline for the ePlayerX is that development will take no more than a year to complete and that the product will be introduced in the market a year from now. Jim and Catherine are aware that there are lots of decisions to make and lots of uncertainties involved, but they need to start somewhere. To this end. Jim and Catherine have decided to base their decisions on a planning horizon of four years, including the development year. They realize that the personal handheld device market is very fluid, with updates to existing products occurring almost continuously. However, they believe they can include such considerations into their cost, revenue, and demand estimates, and that a four-year planning horizon makes sense. In addition, they have identified the following problem parameters. (In this first pass, all distinctions are binary: low-end or high-end, small-effect or large-effect, and so on.) In the absence of cannibalization, the sales of existing eTech products are expected to produce year I net revenues of 10 million, and the forecast of the annual increase in net revenues is 2%. The ePIayerX will be developed as either a low-end or a high-end product, with corresponding fixed development costs (1.5 million or 2.5 million), variable manufacturing costs ( 100 or 200). and selling prices (150 or 300). The fixed development cost is incurred now, at the beginning of year I, and the variable cost and selling price are assumed to remain constant throughout the planning horizon. The new product will be marketed either mildly aggressively or very aggressively, with corresponding costs. The costs of a mildly aggressive marketing campaign are 1.5 million in year 1 and 0.5 million annually in years 2 to 4. For a very aggressive campaign, these costs increase to 3.5 million and 1.5 million, respectively. (These marketing costs are not part of the variable cost mentioned in the previous bullet; they are separate.) Depending on whether the ePlayerX is a low-end or high-end produce the level of the ePlayerXs cannibalization rate of existing eTech products will be either low (10%) or high (20%). Each cannibalization rate affects only sales of existing products in years 2 to 4, not year I sales. For example, if the cannibalization rate is 10%, then sales of existing products in each of years 2 to 4 will be 10% below their projected values without cannibalization. A base case forecast of demand for the ePlayerX is that in its first year on the market, year 2, demand will be for 100,000 units, and then demand will increase by 5% annually in years 3 and 4. This base forecast is based on a low-end version of the ePlayerX and mildly aggressive marketing. It will be adjusted for a high-end will product, aggressive marketing, and competitor behavior. The adjustments with no competing product appear in Table 2.3. The adjustments with a competing product appear in Table 2.4. Each adjustment is to demand for the ePlayerX in each of years 2 to 4. For example, if the adjustment is 10%, then demand in each of years 2 to 4 will be 10% lower than it would have been in the base case. Demand and units sold are the samethat is, eTech will produce exactly what its customers demand so that no inventory or backorders will occur. Table 2.3 Demand Adjustments When No Competing Product Is Introduced Table 2.4 Demand Adjustments When a Competing Product Is Introduced Because Jim and Catherine are approaching the day when they will be sharing their plans with other company executives, they have asked you to prepare an Excel spreadsheet model that will answer the many what-if questions they expect to be asked. Specifically, they have asked you to do the following: You should enter all of the given data in an inputs section with clear labeling and appropriate number formatting. If you believe that any explanations are required, you can enter them in text boxes or cell comments. In this section and in the rest of the model, all monetary values (other than the variable cost and the selling price) should be expressed in millions of dollars, and all demands for the ePlayerX should be expressed in thousands of units. You should have a scenario section that contains a 0/1 variable for each of the binary options discussed here. For example, one of these should be 0 if the low-end product is chosen and it should be 1 if the high-end product is chosen. You should have a parameters section that contains the values of the various parameters listed in the case, depending on the values of the 0/1 variables in the previous bullet For example, the fixed development cost will be 1.5 million or 2.5 million depending on whether the 0/1 variable in the previous bullet is 0 or 1, and this can be calculated with a simple IF formula. You can decide how to implement the IF logic for the various parameters. You should have a cash flows section that calculates the annual cash flows for the four-year period. These cash flows include the net revenues from existing products, the marketing costs for ePlayerX, and the net revenues for sales of ePlayerX (To calculate these latter values, it will help to have a row for annual units sold of ePlayerX.) The cash flows should also include depreciation on the fixed development cost, calculated on a straight-line four-year basis (that is. 25% of the cost in each of the four years). Then, these annual revenues/costs should be summed for each year to get net cash flow before taxes, taxes should be calculated using a 32% tax rate, and taxes should be subtracted and depreciation should be added back in to get net cash flows after taxes. (The point is that depreciation is first subtracted, because it is not taxed, but then it is added back in after taxes have been calculated.) You should calculate the company's NPV for the four-year horizon using a discount rate of 10%. You can assume that the fixed development cost is incurred now. so that it is not discounted, and that all other costs and revenues are incurred at the ends of the respective years. You should accompany all of this with a line chart with three series: annual net revenues from existing products; annual marketing costs for ePlayerX; and annual net revenues from sales of ePlayerX. Once all of this is completed. Jim and Catherine will have a powerful tool for presentation purposes. By adjusting the 0/1 scenario variables, their audience will be able to see immediately, both numerically and graphically, the financial consequences of various scenarios.