(a) What is the level of significance? State the null and alternate hypotheses. O Ho: Hy = Hzi Hy:H1> H2 O Ho: Hy* Hzi Hqi H1 = H2 (b) What sampling distribution will you use? What assumptions are you making? O The Student's t. We assume that both population distributions are approximately normal with unknown standard deviations. O The standard normal. We assume that both population distributions are approximately normal with unknown standard deviations. O The standard normal. We assume that both population distributions are approximately normal with known standard deviations. O The Student's t. We assume that both population distributions are approximately normal with known standard deviations. What is the value of the sample test statistic? (Test the difference 4,- 4z. Round your answer to two decimal places.) (c) Find (or estimate) the P-value. (Round your answer to four decimal places.)
(a) What is the level of significance? State the null and alternate hypotheses. O Ho: Hy = Hzi Hy:H1> H2 O Ho: Hy* Hzi Hqi H1 = H2 (b) What sampling distribution will you use? What assumptions are you making? O The Student's t. We assume that both population distributions are approximately normal with unknown standard deviations. O The standard normal. We assume that both population distributions are approximately normal with unknown standard deviations. O The standard normal. We assume that both population distributions are approximately normal with known standard deviations. O The Student's t. We assume that both population distributions are approximately normal with known standard deviations. What is the value of the sample test statistic? (Test the difference 4,- 4z. Round your answer to two decimal places.) (c) Find (or estimate) the P-value. (Round your answer to four decimal places.)

Glencoe Algebra 1, Student Edition, 9780079039897, 0079039898, 2018
18th Edition
ISBN:9780079039897
Author:Carter
Publisher:Carter
Chapter10: Statistics
Section10.4: Distributions Of Data
Problem 19PFA

Related questions
Topic Video
Question
Transcribed Image Text:A Michigan study concerning preference for outdoor activities used a questionnaire with a six-point Likert-type response in which 1 designated "not important" and 6 designated "extremely
important." A random sample of n, - 41 adults were asked about fishing as an outdoor activity. The mean response was x, = 4.9. Another random sample of n, = 52 adults were asked
about camping as an outdoor activity. For this group, the mean response was x, = 5.7. From previous studies, it is known that o, - 1.6 and o, = 1.9. Does this indicate a difference
(either way) regarding preference for camping versus preference for fishing as an outdoor activity? Use a 5% level of significance.
Note: A Likert scale usually has to do with approval of or agreement with a statement in a questionnaire. For example, respondents are asked to indicate whether they "strongly agree,"
"agree," "disagree," or "strongly disagree" with the statement.
(a) What is the level of significance?
State the null and alternate hypotheses.
(b) What sampling distribution will you use? What assumptions are you making?
The Student's t. We assume that both population distributions are approximately normal with unknown standard deviations.
The standard normal. We assume that both population distributions are approximately normal with unknown standard deviations.
O The standard normal. We assume that both population distributions are approximately normal with known standard deviations.
O The Student's t. We assume that both population distributions are approximately normal with known standard deviations.
What is the value of the sample test statistic? (Test the difference u, - H. Round your answer to two decimal places.)
(c) Find (or estimate) the P-value. (Round your answer to four decimal places.)
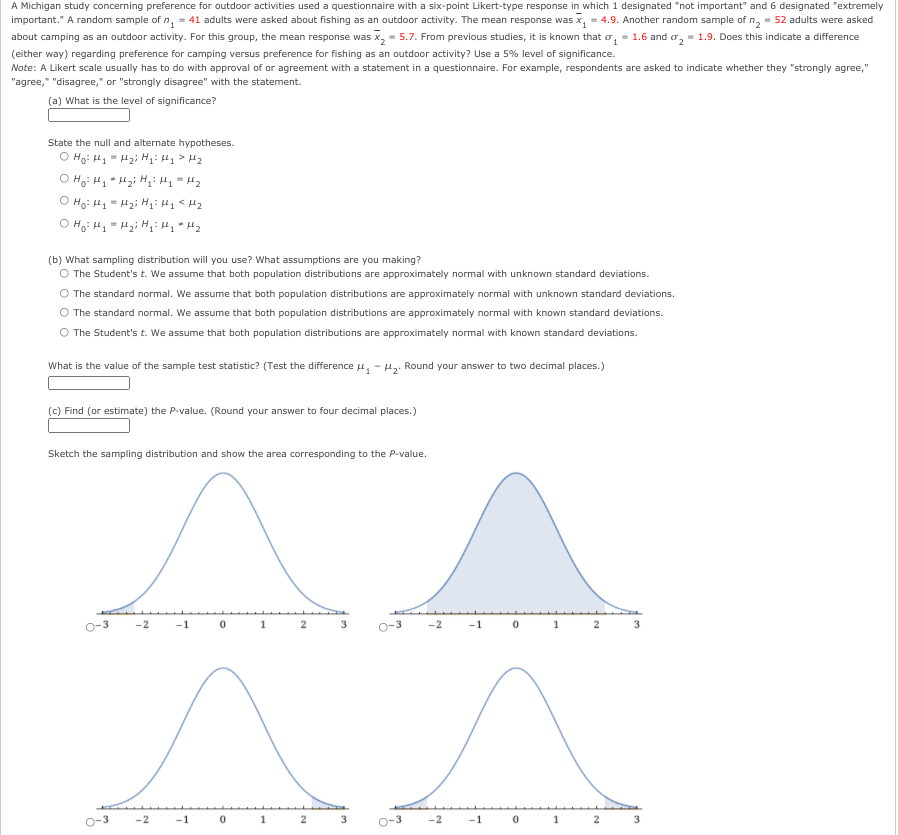
Sketch the sampling distribution and show the area corresponding to the P-value.
O-3
-2
-1
2
o-3
-2
-1
1
3
o-3
-2
-1
1
2
3
o-3
-2
-1
1
2
3
Expert Solution
This question has been solved!
Explore an expertly crafted, step-by-step solution for a thorough understanding of key concepts.

Step by step
Solved in 2 steps with 1 images

Knowledge Booster


Learn more about
Need a deep-dive on the concept behind this application? Look no further. Learn more about this topic, statistics and related others by exploring similar questions and additional content below.Recommended textbooks for you
Glencoe Algebra 1, Student Edition, 9780079039897…
Algebra
ISBN:
9780079039897
Author:
Carter
Publisher:
McGraw Hill

Holt Mcdougal Larson Pre-algebra: Student Edition…
Algebra
ISBN:
9780547587776
Author:
HOLT MCDOUGAL
Publisher:
HOLT MCDOUGAL
Glencoe Algebra 1, Student Edition, 9780079039897…
Algebra
ISBN:
9780079039897
Author:
Carter
Publisher:
McGraw Hill
Holt Mcdougal Larson Pre-algebra: Student Edition…
Algebra
ISBN:
9780547587776
Author:
HOLT MCDOUGAL
Publisher:
HOLT MCDOUGAL