a. Develop a scatter diagram with DJIA as the independent variable. b. Develop the estimated regression equation. c. Test for a significant relationship. Use a = .05.
a. Develop a scatter diagram with DJIA as the independent variable. b. Develop the estimated regression equation. c. Test for a significant relationship. Use a = .05.

MATLAB: An Introduction with Applications
6th Edition
ISBN:9781119256830
Author:Amos Gilat
Publisher:Amos Gilat
Chapter1: Starting With Matlab
Section: Chapter Questions
Problem 1P

Related questions
Topic Video
Question
100%
Please a hand written solution is needed not mini tab or excel, thanks.
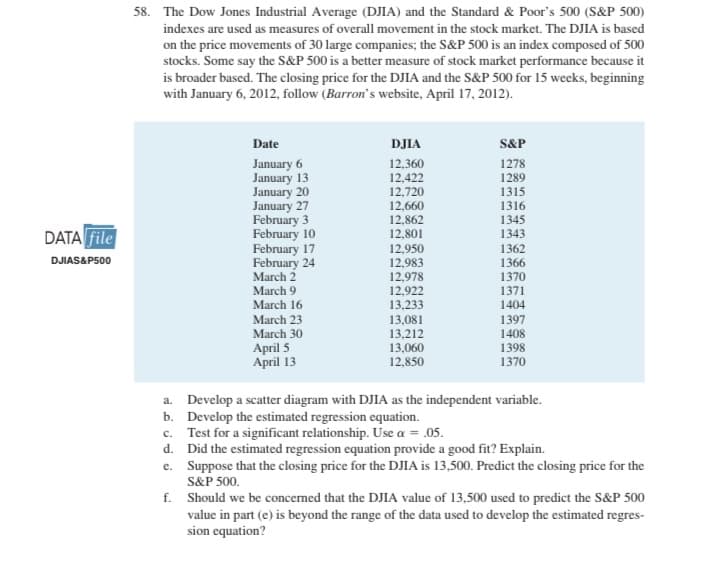
Transcribed Image Text:58. The Dow Jones Industrial Average (DJIA) and the Standard & Poor's 500 (S&P 500)
indexes are used as measures of overall movement in the stock market. The DJIA is based
on the price movements of 30 large companies; the S&P 500 is an index composed of 500
stocks. Some say the S&P 500 is a better measure of stock market performance because it
is broader based. The closing price for the DJIA and the S&P 500 for 15 weeks, beginning
with January 6, 2012, follow (Barron's website, April 17, 2012).
Date
DJIA
S&P
January 6
January 13
January 20
January 27
February 3
February 10
February 17
February 24
March 2
12,360
12,422
12,720
12,660
12,862
12,801
1278
1289
1315
1316
1345
DATA File
1343
12,950
12,983
1362
DJIAS&P500
1366
12,978
12,922
1370
March 9
March 16
1371
13,233
13,081
13,212
13,060
12,850
1404
March 23
March 30
April 5
April 13
1397
1408
1398
1370
a. Develop a scatter diagram with DJIA as the independent variable.
b. Develop the estimated regression equation.
c. Test for a significant relationship. Use a = .05.
d. Did the estimated regression equation provide a good fit? Explain.
e. Suppose that the closing price for the DJIA is 13,500. Predict the closing price for the
S&P 500.
f. Should we be concerned that the DJIA value of 13,500 usced to predict the S&P 500
value in part (e) is beyond the range of the data used to develop the estimated regres-
sion equation?
Expert Solution
This question has been solved!
Explore an expertly crafted, step-by-step solution for a thorough understanding of key concepts.

This is a popular solution!

Trending now
This is a popular solution!

Step by step
Solved in 5 steps with 5 images

Knowledge Booster


Learn more about
Need a deep-dive on the concept behind this application? Look no further. Learn more about this topic, statistics and related others by exploring similar questions and additional content below.Recommended textbooks for you
MATLAB: An Introduction with Applications
Statistics
ISBN:
9781119256830
Author:
Amos Gilat
Publisher:
John Wiley & Sons Inc

Probability and Statistics for Engineering and th…
Statistics
ISBN:
9781305251809
Author:
Jay L. Devore
Publisher:
Cengage Learning

Statistics for The Behavioral Sciences (MindTap C…
Statistics
ISBN:
9781305504912
Author:
Frederick J Gravetter, Larry B. Wallnau
Publisher:
Cengage Learning
MATLAB: An Introduction with Applications
Statistics
ISBN:
9781119256830
Author:
Amos Gilat
Publisher:
John Wiley & Sons Inc
Probability and Statistics for Engineering and th…
Statistics
ISBN:
9781305251809
Author:
Jay L. Devore
Publisher:
Cengage Learning
Statistics for The Behavioral Sciences (MindTap C…
Statistics
ISBN:
9781305504912
Author:
Frederick J Gravetter, Larry B. Wallnau
Publisher:
Cengage Learning

Elementary Statistics: Picturing the World (7th E…
Statistics
ISBN:
9780134683416
Author:
Ron Larson, Betsy Farber
Publisher:
PEARSON

The Basic Practice of Statistics
Statistics
ISBN:
9781319042578
Author:
David S. Moore, William I. Notz, Michael A. Fligner
Publisher:
W. H. Freeman

Introduction to the Practice of Statistics
Statistics
ISBN:
9781319013387
Author:
David S. Moore, George P. McCabe, Bruce A. Craig
Publisher:
W. H. Freeman