a. Plot the data and a regression line on the same graph. b. Determine the correlation coefficient and interpret it.


Q: You are an electronic engineer who is working on the design, production and implementation of…
A: Introduction: This report will focus on the analysis and explanation of a one bit, 3 input majority…
Q: T-3 A T=4 T= 3 AB B T=3 CDEG O None of these O CFG O CDFG E T=4 The figure shows the network diagram…
A: Critical path is the one with maximum duration.
Q: 1. Simulate a 12-day inventory management scenario, assuming that there is an outstanding order of 6…
A: Given a) 12 days simulation:- Formulas:-
Q: Lower Control Limit (LCLx) = enter your response here inches (round your response to three…
A: As found in the previous part of the question, X¯= 3.027916667 R = 1.025416667 A2 = 0.729 , D3 = 0…
Q: Tim Urban, owner/manager of Urban's Motor Court in Key West, is considering outsourcing the daily…
A: The crossover point is characterized as the degree of enrolments at which the total costs for one…
Q: What is a workflow chart and how is it important for business planning purposes?
A: Workflow chart:- The workflow chart is a graphical representation of the business process. There…
Q: Why is designing a successful service operation often more difficult than a successful design of a…
A: Services and products are the backbones of any successful business. From small businesses to large…
Q: 1. Factory PQR produces two products, product X and product Y. The Factory employs five workers:…
A: Decision Variables: Suppose-X be the no. of product x to be manufacturedY be the no. of product y to…
Q: A large corporation maintains a fleet of three 30-passenger corporate jets that provide daily…
A: CASM Is a normally utilized proportion of unit cost in the airline business. CASM is communicated in…
Q: Explain the five (5) modes of entry in Discuss the three (3) basic decision market.
A: It makes sense to consider entering other markets once you've maximized the prospects in your…
Q: Along the Western coast of India, an oil tanker has fouled 100 miles of the shoreline. Fourteen days…
A: Answer: a) 14 days have been given to the oil company. The local crew can clean 5 miles per day So,…
Q: Formulate this scenario as a linear programming problem, making sure you clearly and fully define…
A: Let x be the number of cows, y be the number of hens, l be the number of acres for lettuce, c be the…
Q: Rane Brake Linings gathered information for its brake lining components as presented in the table…
A: Production is the process in which inputs are combined to have the required output. It includes a…
Q: The following are true statements about quality systems except: a. The FDA’s quality systems…
A: Quality of any product is defined by every consumer individually. However, in general terms quality…
Q: Decide in which periods ordering should take place (you can choose the calculation method).
A: Dynamic order size refers to the practice of adjusting the order size in response to changes in…
Q: The question "What are the best practices for integrating suppliers?" is one that has to be asked.
A: Many companies producing pharmaceuticals and medical devices now see supply chain integration as a…
Q: Lower Control Limit (LCLx) =
A: Given the data stated below, For this dataset, I would determine the Lower control limit for the X…
Q: Over the course of a year, if you have an annual physical ($370), visit the doctor twice for illness…
A: The out-of-pocket expenses for fee-for-service plan would be: Premium cost: $270 * 12 months =…
Q: Assume that the normal duration of activity A is 20 days and that it can be shortened to 14 for an…
A: The crash cost of finishing any work is more than the typical cost. The cost of finishing work is…
Q: 1. How the management can overcome the problem of late deliveries of critical machines and equipment…
A: The management can overcome the problem of late deliveries of critical machines and equipment from…
Q: Question 2: The SCO3001 Company sells a new meal kit with the following demand data: 2 3 280 310 The…
A: Exponential smoothing formula: Next forecast = Previous forecast + alpha (Actual - Previous…
Q: When asked another way, what is "Big Data," please define. Just what are the most significant…
A: Big Data refers to the large, complex and diverse datasets that cannot be processed, managed, and…
Q: Subject: Procurement & Sourcing Q): How contract is establish? Q) What are the main terms of…
A: The fact that sourcing must be completed before any procurement can begin is one of the critical…
Q: Question: How does Anna balance demand and capacity by doing a special on bagels from 2 to 4 pm?
A: Anna balances demand and capacity by doing a special on bagels from 2 to 4 pm in several ways: By…
Q: For the network shown below, the arc capacity from node i to node j is the number nearest node i…
A: Linear programming is a mathematical technique that is commonly used in the operations management…
Q: How are supply networks for firms that provide services different from supply chains for…
A: Supply networks or supply chains for firms that provide services different from supply chains for…
Q: a) What is the process capability index for the current manufacturing process?
A: Mean(X) = 91.0 Standard deviation (Sd) = 2.85 Upper control limit(UCL) = 97 Lower control limit(LCL)…
Q: I need a Business Plan including the executive summary and so forth for a day Care business.
A: Executive Summary : There are many families who are become dependent on child care industry.…
Q: Is a high quality product more or less expensive than a poor quality product? Consider all five…
A: A high-quality item will often cost less than a low-quality item. The five costs of quality can be…
Q: Lower Control Limit (LCLx) = 12.179412.1794 inches (round your response to four decimal…
A: Formulae used: Centre line of the X bar chart = Average of the X bar chart Control limit of the X…
Q: Ellen, a citizen of California, was seriously injured in an automobile accident while driving in…
A: 1. Ellen brings her suit where the accident took place. According to the data, we can conclude that…
Q: Case Study: Anna runs a small cafe that’s really busy at lunchtime but quiet at other times. She…
A: Anna is a cafe owner, who is facing a problem where there are a lot of customers during lunchtime…
Q: (creat3 a DATA FLOW DIAGRAM for the Creat3 a DATA FLOW DIAGRAM for the CASH RECEIPTS SYSTEM that is…
A: A data flow diagram (DFD) is a graphical representation of data flowing through a system. It can be…
Q: A project consists of seven activities. The following table shows the estimated time of the…
A: By identifying the actions that are essential to the project schedule, the critical route technique…
Q: The cement additive, Tuf should not contain more than 70% of Lime and the cement additive, Rok must…
A:
Q: a) Design a reorder point system using the 99% probability of being in stock and (i) state the…
A: Since there are more than 10 questions, we will answer only first 3. For others please submit as…
Q: Supply chain management has been a very vital tool in the competitive world of business, and this…
A: Supply chain management is the most common way of coordinating the supply and request management,…
Q: Green Capital, Inc. (GC) is a small investment banking firm that specializes in securing funds for…
A: Find the Given details below: Activity Predecessor Optimistic Time(To) a(Week) Pessimistic…
Q: the key elements for Operations Management in Business?
A: The management of processes and operations inside an organization is one of the functions of…
Q: Perform a financial analysis for a project using the Net Present Value method. Assume the projected…
A: The Net Present Value (NPV) is a technique that is basically utilized for financial analysis in…
Q: How can lean manufacturing be incorporated in the assembly line for the new car to reduce waste on…
A: To cut waste on this assembly line, lean manufacturing may be used in a number of ways for a new…
Q: Given the following information, which is the critical path? Activity Immediate Predecessor(s) A B C…
A: The Critical Path Method, a potent yet fundamentally straightforward method for assessing, planning,…
Q: What kind of link is created between the different functional units by ERP?
A: ERP or Enterprise Resource Planning is a business management software that organizations use to…
Q: a. what are the upper and lower control limits for C chart" b. Draw the graph of C chart with sample…
A: For the given data, I would determine the UCL and LCL values for the C chart, then, I would create a…
Q: If labor laws were repealed how would it affect the formation of unions and the terms and conditions…
A: An organization's greatest asset is its workforce. One resource alone significantly influences the…
Q: 6.9: An order for 250 bell ringers is processed on work centers 10 and 20. The setup and run times…
A: Setup on 10 = 50 minutesRun time on 10 = 5 minutes per pieceSetup on 20 = 100 minutesRun time on 20…
Q: Complete the following table by computing the opportunity cost of Ciana's time and the total cost of…
A: To calculate Opportunity Cost, we must first calculate the two way time to travel to each store…
Q: A company makes 110-inch wide rolls of thin sheet metal and slices them in smaller rolls of 12, 15,…
A: Objective Functions and Constraints: Based on the given details, the objective…
Q: At Quick Car Wash, the wash process is advertised to take less than 7 minutes. Consequently,…
A: Formulae used: Control limit of the X bar: UCLx = X-double bar + A2×R bar LCLx = X-double bar -…
Q: A company will be producing the same new product at two different factories, and then the product…
A: (a)
C3Q25#2
Please see the screen shot and help me solve the problem. Please give me the steps that you used to find the solution so that I can learn to solve:
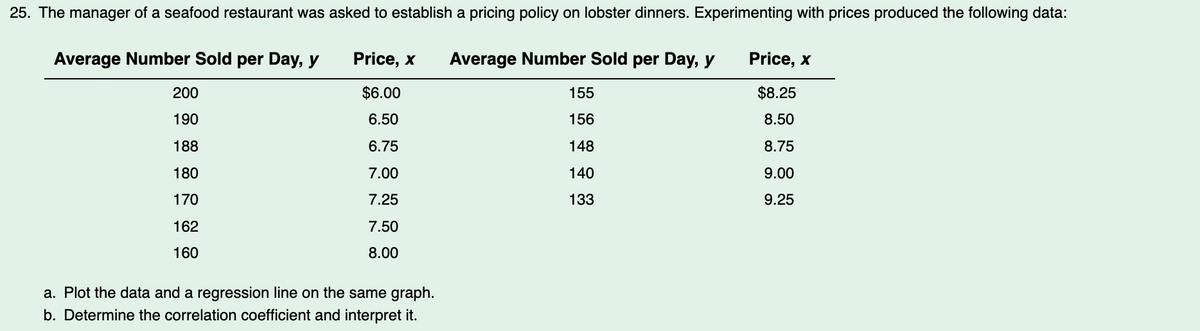
For the given dataset, I would plot the data, add the trend or regression line, I would also determine the correlation coefficient, The detailed calculations are presented below,

Trending now
This is a popular solution!

Step by step
Solved in 2 steps with 4 images

- The Baker Company wants to develop a budget to predict how overhead costs vary with activity levels. Management is trying to decide whether direct labor hours (DLH) or units produced is the better measure of activity for the firm. Monthly data for the preceding 24 months appear in the file P13_40.xlsx. Use regression analysis to determine which measure, DLH or Units (or both), should be used for the budget. How would the regression equation be used to obtain the budget for the firms overhead costs?Do the sales prices of houses in a given community vary systematically with their sizes (as measured in square feet)? Answer this question by estimating a simple regression equation where the sales price of the house is the dependent variable, and the size of the house is the explanatory variable. Use the sample data given in P13_06.xlsx. Interpret your estimated equation, the associated R-square value, and the associated standard error of estimate.Under what conditions might a firm use multiple forecasting methods?
- A small computer chip manufacturer wants to forecast monthly ozperating costs as a function of the number of units produced during a month. The company has collected the 16 months of data in the file P13_34.xlsx. a. Determine an equation that can be used to predict monthly production costs from units produced. Are there any outliers? b. How could the regression line obtained in part a be used to determine whether the company was efficient or inefficient during any particular month?The file P13_42.xlsx contains monthly data on consumer revolving credit (in millions of dollars) through credit unions. a. Use these data to forecast consumer revolving credit through credit unions for the next 12 months. Do it in two ways. First, fit an exponential trend to the series. Second, use Holts method with optimized smoothing constants. b. Which of these two methods appears to provide the best forecasts? Answer by comparing their MAPE values.1.) Use the following dummy variables to develop an estimated regression equation to account for seasonal effects only in the data. Qtr1 = 1 if Quarter 1, 0otherwise; Qtr2 = 1 if Quarter 2, 0 otherwise, Qtr3 = 1 if Quarter 3, 0otherwise. Based only on the seasonal effects in the data, compute estimates of quarterly sales for year 6.a. Report the estimate of sales for Year 6 Quarter 1. (Enter a whole value.)b. Report the estimate of sales for Year 6 Quarter 4. (Enter a whole value.)2.) Let Period t = 1 refer to the observation in quarter 1 of year 1; Period t = 2refer to the observation in quarter 2 or year 1; … and Period t = 20 refer to the observation in quarter 4 of year 5. Using the dummy variables defined in part (b) and Period (t), develop an estimated regression equation to account for seasonal effects and any linear trend in the time series. Based upon the seasonal effects in the data and linear trend, compute the estimates of quarterly sales for year 6.a. Report the estimate…
- Regression analysis. The owner of a small hardware store has noted a sales pattern for window locks that seems to parallel the number of break-ins reported each week in the newspaper. The data are: Sales: 46 18 20 22 27 34 14 37 30Break-ins: 9 3 3 5 4 7 2 6 4a. Plot the data to determine which type of equation, linear or nonlinear, is appropriate.b. Obtain a regression equation for the data.c. Estimate average sales when the number of break-ins is five.A study to determine the correlation between bankdeposits and consumer price indices in Birmingham, Alabama,revealed the following (which was based on n = 5 years of da ta):• LX = 15• Lx2 = 55• Lxy = 70• Ly = 20• L/ = 130a) What is the equation of the least-squares regression line?b) Find the coefficient of correlation. What does it imply to you?c) What is the standard error of the estimate?7. The following multiple-regression model was developed to predict job performance as measured by a company job performance evaluation index based on a preemployment test score and college grade point average (GPA): y=35+20x1+50x2, where y=job performance evaluation index, x1=preemployment test score, and x2=college GPA. Part 2 a) For an applicant who had a 3.0 GPA and scored 80 on the preemployment test, the forecast for the job performance index= __________ (enter your response as a whole number).
- The following data were collected during a study of consumer buying patterns:Observation x y Observation x y 1 19 72 8 20 77 2 21 81 9 17 73 3 43 79 10 13 77 4 28 81 11 20 85 5 56 98 12 28 93 6 49 96 13 34 94 7 32 82 14a. Obtain a linear regression line for the data.b. What percentage of the variation is explained by the regression line?c. Use the equation determined in part b to predict the expected value of y for x = 49.Calculate a regression line for the data and indicate the forecast of sales for a store with advertising spending of R240,000? and R300,000? Store Advertising Sales 1 14 6 2 11 3 3 15 5 4 16 5 5 24 15 6 28 18 7 22 17 8 21 12 9 26 15 10 43 20 11 34 14 12 9 5Chart and Regression analysis : What does the intercept predict? X: C16 (number of cars on the sales lot) versus Y: C17 (cars sold per day) Equation: y=2.9x + 14.5 Slope:2.9 Intercept:14.5 Does the intercept mean the intercept is 14.5 means that the cars sold per day( Y) predicted number of cars on sale lot(X) to be 14.5, but this intercept has no meaning. So, I will not use to predict cars sold per day?
