
Mathematics For Machine Technology
8th Edition
ISBN:9781337798310
Author:Peterson, John.
Publisher:Peterson, John.
Chapter16: Table Of Decimal Equivalents And Combined Operations Of Decimal Fractions
Section: Chapter Questions
Problem 32A

Related questions

Concept explainers
Contingency Table
A contingency table can be defined as the visual representation of the relationship between two or more categorical variables that can be evaluated and registered. It is a categorical version of the scatterplot, which is used to investigate the linear relationship between two variables. A contingency table is indeed a type of frequency distribution table that displays two variables at the same time.
Binomial Distribution
Binomial is an algebraic expression of the sum or the difference of two terms. Before knowing about binomial distribution, we must know about the binomial theorem.
Topic Video
Question
Answer everything
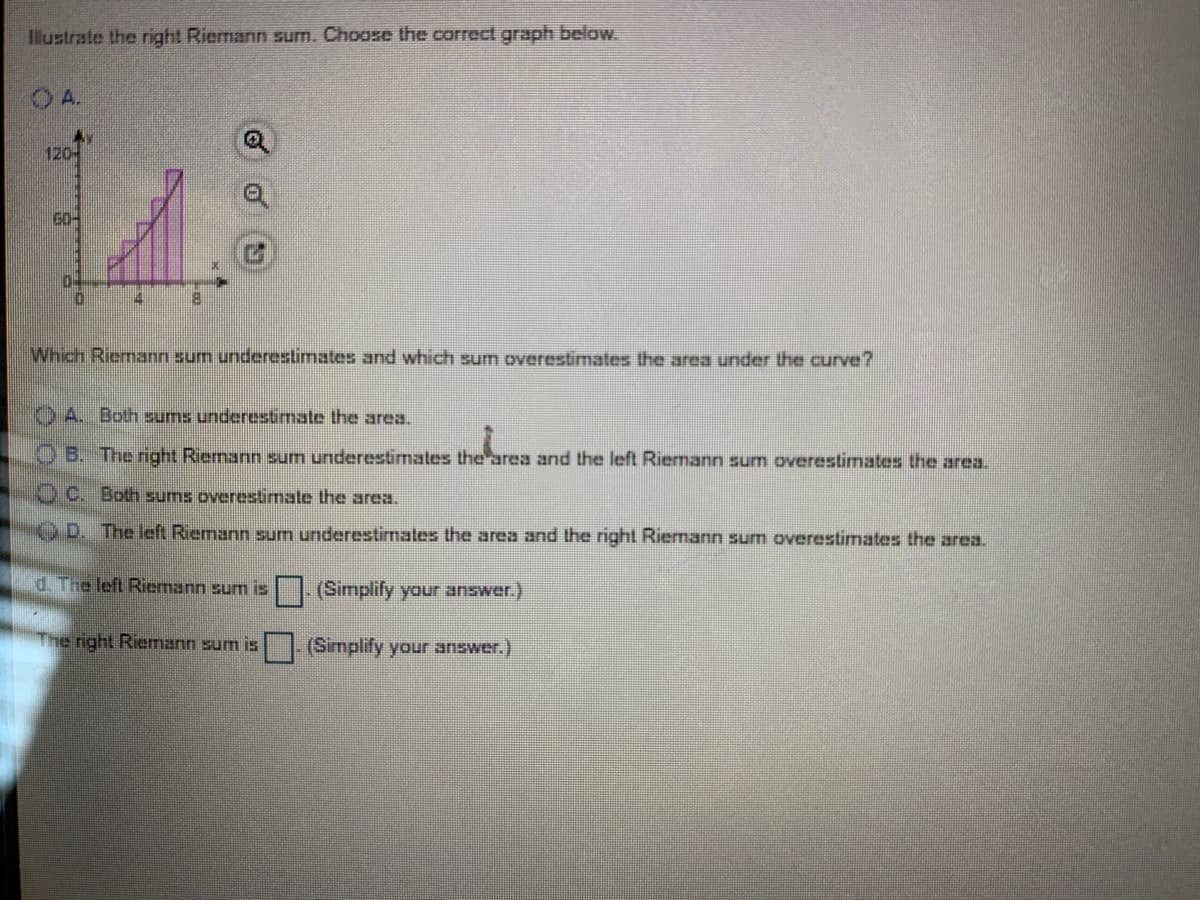
Transcribed Image Text:lustrate the right Riemann sum. Choose the correct graph below.
O A.
120
60-
8.
Which Riemann sum underestimates and which sun overestimates the area under the curve?
OA Both sums underestimate the area.
OB. The right Riemann sum underestimates the area and the left Riemann sum overestimates the area
OC. Both sums overestimate the area.
OD The left Riemann sum underestimates the area and the right Riemann sum overestimates the area.
d. The left Riemann sum is
(Simplify your answer.)
The right Riemann sum is
|| (Simplify your answer.)
![Complete the following steps for the given function, interval, and value of n.
a. Sketch the graph of the function on the given interval.
b. Calculate Ax and the grid points x. X. x
c. Illustrate the left and right Riemann sums, and determine which Riemann sum underestimates and which sum overestimates the area under the curve.
d. Calculate the left and right Riemann sums.
f(x) = 2x +5 on [2.7); n = 5
a. Sketch the graph of f(x) = 2x + 5 on the interval [2, 7]. Choose the correct graph below.
O
A.
OB
OC.
OD.
110-
110
Q
110
14
210
b. Ax=
List the grid points
(Use a comma to separate answers as needed.)
c. Illustrate the left Riemann sum. Choose the correct graph below.
O A.
OB.
OC
120-
1204
60-
604
Illustrate the right Riemann sum. Choose the correct graph below.
OB.
14
OA.
120
120-
60
Which Riemann sum underestimates and which sum overestimates the area under the curve?
O A. Both sums underestimate the area.
OB. The right Riemann sum underestimates the area and the left Riemann sum overestimates the area
OC. Both sums overestimate the area
OD. The left Riemann sum underestimates the area and the right Riemann sum overestimates the area
d. The left Riemann sum is (Simplify your answer)
The right Riemann sum isO (Simplify your answer)](/v2/_next/image?url=https%3A%2F%2Fcontent.bartleby.com%2Fqna-images%2Fquestion%2F1df78ed7-7bf9-40d0-9ea6-9fdf014e5eeb%2F6f67966a-e0b6-43e9-93fe-36ed0ff017db%2Fcl8skf_processed.jpeg&w=3840&q=75)
Transcribed Image Text:Complete the following steps for the given function, interval, and value of n.
a. Sketch the graph of the function on the given interval.
b. Calculate Ax and the grid points x. X. x
c. Illustrate the left and right Riemann sums, and determine which Riemann sum underestimates and which sum overestimates the area under the curve.
d. Calculate the left and right Riemann sums.
f(x) = 2x +5 on [2.7); n = 5
a. Sketch the graph of f(x) = 2x + 5 on the interval [2, 7]. Choose the correct graph below.
O
A.
OB
OC.
OD.
110-
110
Q
110
14
210
b. Ax=
List the grid points
(Use a comma to separate answers as needed.)
c. Illustrate the left Riemann sum. Choose the correct graph below.
O A.
OB.
OC
120-
1204
60-
604
Illustrate the right Riemann sum. Choose the correct graph below.
OB.
14
OA.
120
120-
60
Which Riemann sum underestimates and which sum overestimates the area under the curve?
O A. Both sums underestimate the area.
OB. The right Riemann sum underestimates the area and the left Riemann sum overestimates the area
OC. Both sums overestimate the area
OD. The left Riemann sum underestimates the area and the right Riemann sum overestimates the area
d. The left Riemann sum is (Simplify your answer)
The right Riemann sum isO (Simplify your answer)
Expert Solution
This question has been solved!
Explore an expertly crafted, step-by-step solution for a thorough understanding of key concepts.

Step by step
Solved in 3 steps with 6 images

Knowledge Booster


Learn more about
Need a deep-dive on the concept behind this application? Look no further. Learn more about this topic, calculus and related others by exploring similar questions and additional content below.Recommended textbooks for you
Mathematics For Machine Technology
Advanced Math
ISBN:
9781337798310
Author:
Peterson, John.
Publisher:
Cengage Learning,

Algebra & Trigonometry with Analytic Geometry
Algebra
ISBN:
9781133382119
Author:
Swokowski
Publisher:
Cengage

Trigonometry (MindTap Course List)
Trigonometry
ISBN:
9781337278461
Author:
Ron Larson
Publisher:
Cengage Learning
Mathematics For Machine Technology
Advanced Math
ISBN:
9781337798310
Author:
Peterson, John.
Publisher:
Cengage Learning,
Algebra & Trigonometry with Analytic Geometry
Algebra
ISBN:
9781133382119
Author:
Swokowski
Publisher:
Cengage
Trigonometry (MindTap Course List)
Trigonometry
ISBN:
9781337278461
Author:
Ron Larson
Publisher:
Cengage Learning

