a. Upload your completed file below. Question 1 Part 1 of 5Choose FileNo file chosen Now use your graph to answer the following questions. b. About 95% of men will have blood pressure between what amounts? and c. What percentage of men will have a systolic blood pressure outside the range 97 mm to 139 mm?


Continuous Probability Distributions
Probability distributions are of two types, which are continuous probability distributions and discrete probability distributions. A continuous probability distribution contains an infinite number of values. For example, if time is infinite: you could count from 0 to a trillion seconds, billion seconds, so on indefinitely. A discrete probability distribution consists of only a countable set of possible values.
Normal Distribution
Suppose we had to design a bathroom weighing scale, how would we decide what should be the range of the weighing machine? Would we take the highest recorded human weight in history and use that as the upper limit for our weighing scale? This may not be a great idea as the sensitivity of the scale would get reduced if the range is too large. At the same time, if we keep the upper limit too low, it may not be usable for a large percentage of the population!
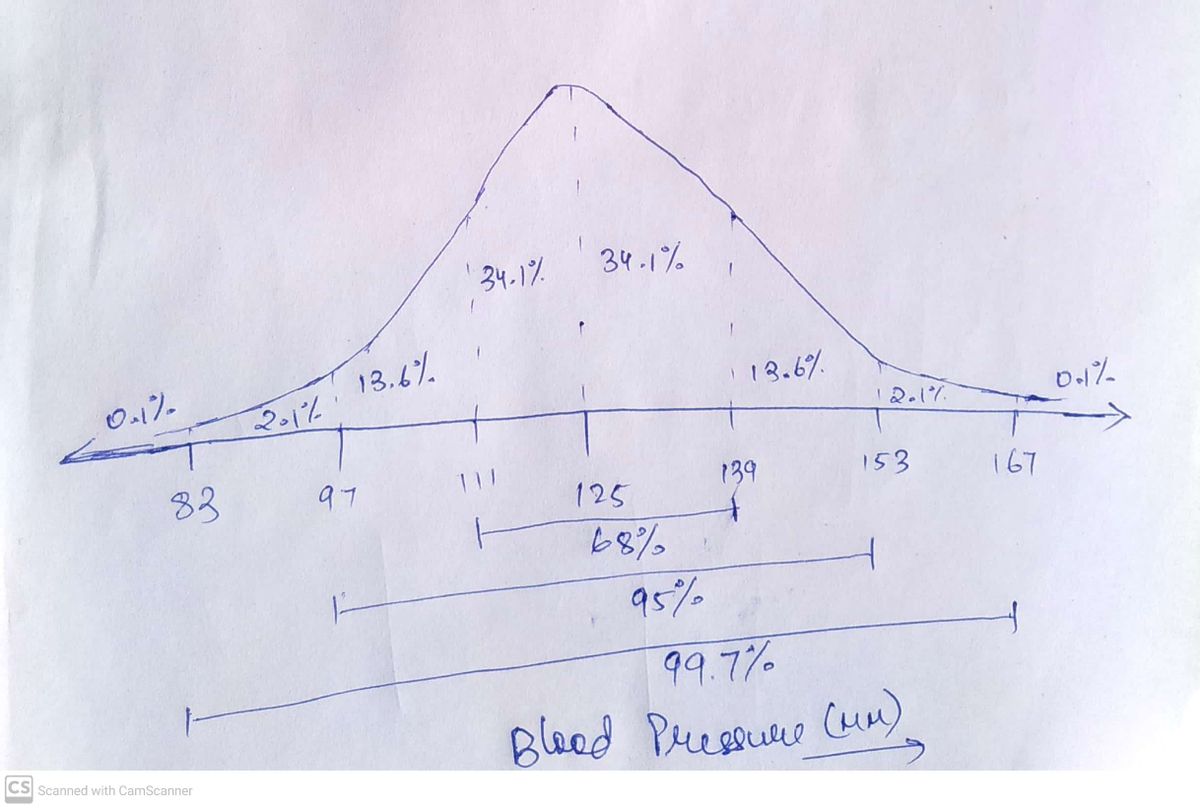
Suppose the systolic blood pressure (in mm) of adult males has an approximately
Create an
- A title and label for the horizontal axis including units.
- Vertical lines for the mean and first 3 standard deviations in each direction with numerical labels on the horizontal axis
- Labels for the areas of the 8 regions separated by the vertical lines as well.
Note: This may be hand drawn or computer generated. See the models for desired formats.
a. Upload your completed file below. Question 1 Part 1 of 5Choose FileNo file chosen
Now use your graph to answer the following questions.
b. About 95% of men will have blood pressure between what amounts?
and
c. What percentage of men will have a systolic blood pressure outside the
d. Suppose you are a health practitioner and an adult male patient has systolic blood pressure of 168 mm. Use statistics to explain the gravity of his situation. Write an essay below that includes the following:
- A brief description of the normal distribution.
- Why the normal distribution might apply to this situation.
- Describe the specific normal distribution for this situation (give the mean and standard deviation)
- A brief description of the empirical rule
- What region of the graph (drawn in part a) the individual falls in
- An estimate of individual's percentile.
- Why this signifies a health concern.
- A suggested course of action.
u = 125
sigma =14
a)

Trending now
This is a popular solution!

Step by step
Solved in 2 steps with 1 images


