AARP claims the average annual expenditure for Americans age 50+ on restaurant food in 2008 was $2130. Suppose a 2018 study randomly sampled 32 A age 50+ and found an average annual expenditure on restaurant food of $1945 with a standard deviation of sa00, Is there reason to believe that the avera expenditure for Americans age 50+ on restaurant food has decreased since 2008 at e17 For the hypothesis stated above, what is the decision? Oa, Fail to reject Ho because the test statistic is to the right of the critical value which, in this case, is negative O b. None of the answers is correct OC. Reject Ho because the test statistic is to the right of the critical value which, in this case, is positive. Od. Reject Ho because the test statistic is to the left of the critical value which, in this case, is negative. Oe. Fail to reject Ho because the test statistic is to the left of the critical value which, in this case, is positive.
AARP claims the average annual expenditure for Americans age 50+ on restaurant food in 2008 was $2130. Suppose a 2018 study randomly sampled 32 A age 50+ and found an average annual expenditure on restaurant food of $1945 with a standard deviation of sa00, Is there reason to believe that the avera expenditure for Americans age 50+ on restaurant food has decreased since 2008 at e17 For the hypothesis stated above, what is the decision? Oa, Fail to reject Ho because the test statistic is to the right of the critical value which, in this case, is negative O b. None of the answers is correct OC. Reject Ho because the test statistic is to the right of the critical value which, in this case, is positive. Od. Reject Ho because the test statistic is to the left of the critical value which, in this case, is negative. Oe. Fail to reject Ho because the test statistic is to the left of the critical value which, in this case, is positive.

MATLAB: An Introduction with Applications
6th Edition
ISBN:9781119256830
Author:Amos Gilat
Publisher:Amos Gilat
Chapter1: Starting With Matlab
Section: Chapter Questions
Problem 1P

Related questions
Topic Video
Question
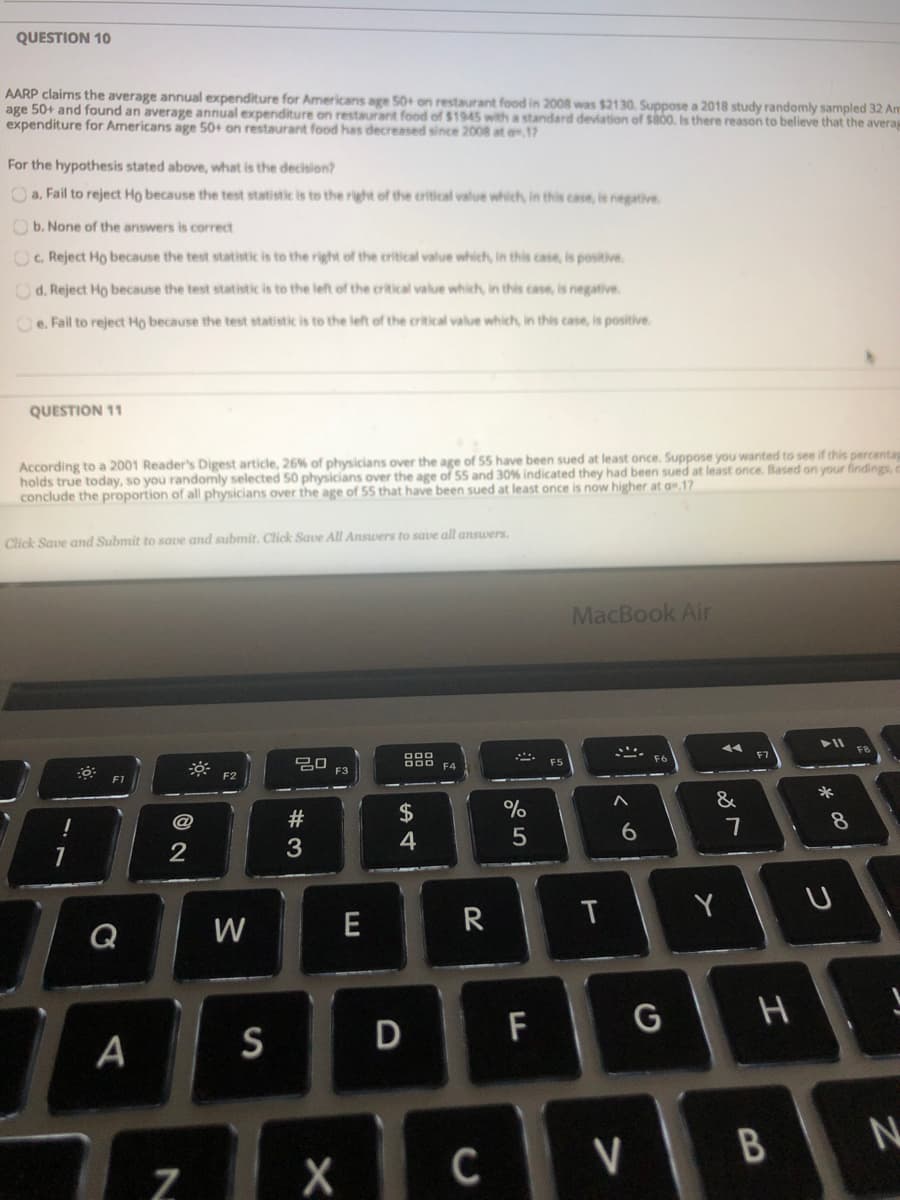
Transcribed Image Text:QUESTION 10
AARP claims the average annual expenditure for Americans age 50+ on restaurant food in 2008 was $2130. Suppose a 2018 study randomly sampled 32 Am
age 50+ and found an average annual expenditure on restaurant food of $1945 with a standard deviation of sa0o, Is there reason to believe that the averag
expenditure for Americans age 50+ on restaurant food has decreased since 2008 at e17
For the hypothesis stated above, what is the decision?
Oa, Fail to reject Ho because the test statistic is to the right of the critical value which, in this case, is negative.
b. None of the answers is correct
O. Reject Ho because the test statistic is to the right of the critical value which, in this case, is positive.
Od. Reject Ho because the test statistic is to the left of the critical value which, in this case, is negative.
Oe. Fail to reject Ho because the test statistic is to the left of the critical value which, in this case, is positive.
QUESTION 11
According to a 2001 Reader's Digest article, 26% of physicians over the age of 55 have been sued at least once. Suppose you wanted to see if this percentag
holds true today, so you randomly selected 50 physicians over the age of 55 and 30% indicated they had been sued at least once. Based on your findings, c
conclude the proportion of all physicians over the age of 55 that have been sued at least once is now higher at a.17
Click Save and Submit to save and submit. Click Save All Answers to save all answers.
MacBook Air
F5
F3
F2
F1
*
&
#
$
%
2
3
4
1
R
T
Q
W
F
G
A
S D
Z
Expert Solution
This question has been solved!
Explore an expertly crafted, step-by-step solution for a thorough understanding of key concepts.

This is a popular solution!

Trending now
This is a popular solution!

Step by step
Solved in 2 steps

Knowledge Booster


Learn more about
Need a deep-dive on the concept behind this application? Look no further. Learn more about this topic, statistics and related others by exploring similar questions and additional content below.Recommended textbooks for you
MATLAB: An Introduction with Applications
Statistics
ISBN:
9781119256830
Author:
Amos Gilat
Publisher:
John Wiley & Sons Inc

Probability and Statistics for Engineering and th…
Statistics
ISBN:
9781305251809
Author:
Jay L. Devore
Publisher:
Cengage Learning

Statistics for The Behavioral Sciences (MindTap C…
Statistics
ISBN:
9781305504912
Author:
Frederick J Gravetter, Larry B. Wallnau
Publisher:
Cengage Learning
MATLAB: An Introduction with Applications
Statistics
ISBN:
9781119256830
Author:
Amos Gilat
Publisher:
John Wiley & Sons Inc
Probability and Statistics for Engineering and th…
Statistics
ISBN:
9781305251809
Author:
Jay L. Devore
Publisher:
Cengage Learning
Statistics for The Behavioral Sciences (MindTap C…
Statistics
ISBN:
9781305504912
Author:
Frederick J Gravetter, Larry B. Wallnau
Publisher:
Cengage Learning

Elementary Statistics: Picturing the World (7th E…
Statistics
ISBN:
9780134683416
Author:
Ron Larson, Betsy Farber
Publisher:
PEARSON

The Basic Practice of Statistics
Statistics
ISBN:
9781319042578
Author:
David S. Moore, William I. Notz, Michael A. Fligner
Publisher:
W. H. Freeman

Introduction to the Practice of Statistics
Statistics
ISBN:
9781319013387
Author:
David S. Moore, George P. McCabe, Bruce A. Craig
Publisher:
W. H. Freeman