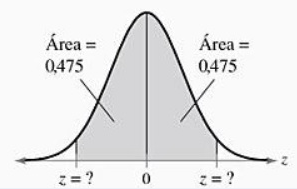
According to the attached normal distribution graph, which are the z-scores of the graph: a) -1,96 and 1,96 b) -1,65 and 1,65 c) -1,64 and 1,64 d) -0,07 and 0,07
According to the attached normal distribution graph, which are the z-scores of the graph: a) -1,96 and 1,96 b) -1,65 and 1,65 c) -1,64 and 1,64 d) -0,07 and 0,07

Glencoe Algebra 1, Student Edition, 9780079039897, 0079039898, 2018
18th Edition
ISBN:9780079039897
Author:Carter
Publisher:Carter
Chapter10: Statistics
Section10.5: Comparing Sets Of Data
Problem 1GP

Related questions

Question
According to the attached
a) -1,96 and 1,96
b) -1,65 and 1,65
c) -1,64 and 1,64
d) -0,07 and 0,07
Expert Solution
Step 1
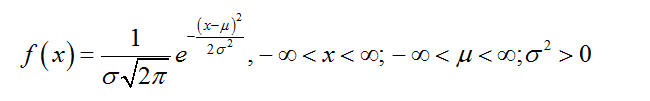
The normal distribution:
A continuous random variable X is said to follow normal distribution with mean µ and standard deviation σ if the probability density function of X is,
Step 2
It is given that area between 0 and z is 0.475.
It is known that area below (or above) to the point 0 in a standard normal curve is 0.50.
Thus, area between -∞ and lower z is 0.5-0.475 =0.025.
Consider the standard normal table given below:
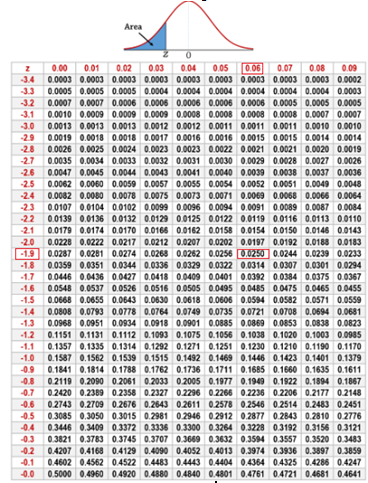
From the above table lower value of z is -1.96.

Step by step
Solved in 4 steps with 3 images

Knowledge Booster


Learn more about
Need a deep-dive on the concept behind this application? Look no further. Learn more about this topic, probability and related others by exploring similar questions and additional content below.Recommended textbooks for you
Glencoe Algebra 1, Student Edition, 9780079039897…
Algebra
ISBN:
9780079039897
Author:
Carter
Publisher:
McGraw Hill
Glencoe Algebra 1, Student Edition, 9780079039897…
Algebra
ISBN:
9780079039897
Author:
Carter
Publisher:
McGraw Hill