According to the Centers for Disease Control and Prevention (CDC), the mean BMI of U.S. men of age 40–49 years old is 28.4 Using the provided sample data file, conduct a one-sample ?-z-test of a mean to test whether the mean BMI of men of age 40–49 years old who smoke daily is lower than 28.4. Conduct the ?-z-test at a significance level of ?=0.05 to test the null hypothesis, ?0:?=28.4, against the alternative hypothesis, ?1:?<28.4, where ?μ represents the mean BMI of U.S. men of age 40–49 who smoke daily. Assume that the population standard deviation of BMI, ?σ, is 8.346 The sample data provided contain BMI results collected from a 2015 survey conducted by the National Center for Health Statistics for men of age 40–49 who smoke daily. Calculate the sample mean, ?⎯⎯⎯x¯, for this data. Give your answer precise to at least one decimal place. Calculate the sample mean, ?⎯⎯⎯x¯, for this data. Give your answer precise to at least one decimal place. Compute the standard deviation, SD, of the sampling distribution of the mean. (Some people call this the standard error.) Give your answer with precision to at least two decimal places. Next, determine the ?-statisticz-statistic for this hypothesis test. Provide your answer with precision to two decimal places. Avoid rounding until the final step. compute the ?-valueP-value for the ?-statisticz-statistic. Give your answer precise to at least three decimal places. compute the ?-valueP-value for the ?-statisticz-statistic. Give your answer precise to at least three decimal places.


According to the Centers for Disease Control and Prevention (CDC), the mean BMI of U.S. men of age 40–49 years old is 28.4 Using the provided sample data file, conduct a one-sample ?-z-test of a mean to test whether the mean BMI of men of age 40–49 years old who smoke daily is lower than 28.4.
Conduct the ?-z-test at a significance level of ?=0.05 to test the null hypothesis, ?0:?=28.4, against the alternative hypothesis, ?1:?<28.4, where ?μ represents the mean BMI of U.S. men of age 40–49 who smoke daily. Assume that the population standard deviation of BMI, ?σ, is 8.346
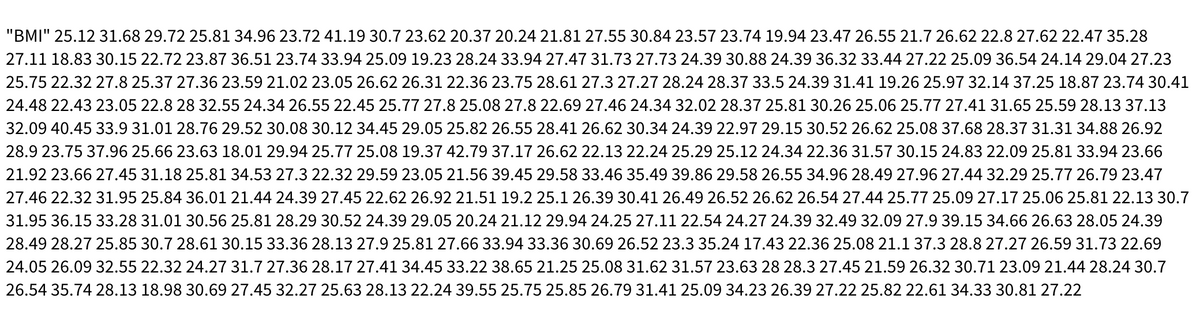
The sample data provided contain BMI results collected from a 2015 survey conducted by the National Center for Health Statistics for men of age 40–49 who smoke daily. Calculate the sample mean, ?⎯⎯⎯x¯, for this data. Give your answer precise to at least one decimal place.
Calculate the sample mean, ?⎯⎯⎯x¯, for this data. Give your answer precise to at least one decimal place.
Compute the standard deviation, SD, of the sampling distribution of the mean. (Some people call this the standard error.) Give your answer with precision to at least two decimal places.
Next, determine the ?-statisticz-statistic for this hypothesis test. Provide your answer with precision to two decimal places. Avoid rounding until the final step.
compute the ?-valueP-value for the ?-statisticz-statistic. Give your answer precise to at least three decimal places.
compute the ?-valueP-value for the ?-statisticz-statistic. Give your answer precise to at least three decimal places.


Trending now
This is a popular solution!

Step by step
Solved in 3 steps


