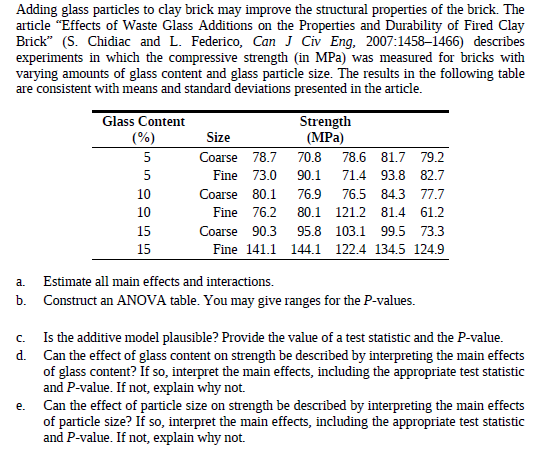
Adding glass particles to clay brick may improve the structural properties of the brick. The article "Effects of Waste Glass Additions on the Properties and Durability of Fired Clay Brick" (S. Chidiac and L. Federico, Can J Civ Eng, 2007:1458–1466) describes experiments in which the compressive strength (in MPa) was measured for bricks with varying amounts of glass content and glass particle size. The results in the following table are consistent with means and standard deviations presented in the article. Glass Content (%) Strength (MPa) Size 5 Coarse 78.7 70.8 78.6 81.7 79.2 5 Fine 73.0 90.1 71.4 93.8 82.7 10 Coarse 80.1 76.9 76.5 84.3 77.7 10 Fine 76.2 80.1 121.2 81.4 61.2 15 Coarse 90.3 95.8 103.1 99.5 73.3 15 Fine 141.1 144.1 122.4 134.5 124.9 a. Estimate all main effects and interactions. b. Construct an ANOVA table. You may give ranges for the P-values. Is the additive model plausible? Provide the value of a test statistic and the P-value. Can the effect of glass content on strength be described by interpreting the main effects of glass content? If so, interpret the main effects, including the appropriate test statistic and P-value. If not, explain why not. C. d. Can the effect of particle size on strength be described by interpreting the main effects of particle size? If so, interpret the main effects, including the appropriate test statistic and P-value. If not, explain why not. e.
Adding glass particles to clay brick may improve the structural properties of the brick. The article "Effects of Waste Glass Additions on the Properties and Durability of Fired Clay Brick" (S. Chidiac and L. Federico, Can J Civ Eng, 2007:1458–1466) describes experiments in which the compressive strength (in MPa) was measured for bricks with varying amounts of glass content and glass particle size. The results in the following table are consistent with means and standard deviations presented in the article. Glass Content (%) Strength (MPa) Size 5 Coarse 78.7 70.8 78.6 81.7 79.2 5 Fine 73.0 90.1 71.4 93.8 82.7 10 Coarse 80.1 76.9 76.5 84.3 77.7 10 Fine 76.2 80.1 121.2 81.4 61.2 15 Coarse 90.3 95.8 103.1 99.5 73.3 15 Fine 141.1 144.1 122.4 134.5 124.9 a. Estimate all main effects and interactions. b. Construct an ANOVA table. You may give ranges for the P-values. Is the additive model plausible? Provide the value of a test statistic and the P-value. Can the effect of glass content on strength be described by interpreting the main effects of glass content? If so, interpret the main effects, including the appropriate test statistic and P-value. If not, explain why not. C. d. Can the effect of particle size on strength be described by interpreting the main effects of particle size? If so, interpret the main effects, including the appropriate test statistic and P-value. If not, explain why not. e.

MATLAB: An Introduction with Applications
6th Edition
ISBN:9781119256830
Author:Amos Gilat
Publisher:Amos Gilat
Chapter1: Starting With Matlab
Section: Chapter Questions
Problem 1P

Related questions
Question
Transcribed Image Text:Adding glass particles to clay brick may improve the structural properties of the brick. The
article "Effects of Waste Glass Additions on the Properties and Durability of Fired Clay
Brick" (S. Chidiac and L. Federico, Can J Civ Eng, 2007:1458–1466) describes
experiments in which the compressive strength (in MPa) was measured for bricks with
varying amounts of glass content and glass particle size. The results in the following table
are consistent with means and standard deviations presented in the article.
Glass Content
(%)
Strength
(MPa)
Size
5
Coarse 78.7
70.8
78.6 81.7 79.2
5
Fine 73.0
90.1
71.4 93.8 82.7
10
Coarse 80.1
76.9
76.5 84.3 77.7
10
Fine 76.2
80.1 121.2 81.4 61.2
15
Coarse 90.3
95.8 103.1 99.5 73.3
15
Fine 141.1 144.1 122.4 134.5 124.9
a.
Estimate all main effects and interactions.
b. Construct an ANOVA table. You may give ranges for the P-values.
Is the additive model plausible? Provide the value of a test statistic and the P-value.
Can the effect of glass content on strength be described by interpreting the main effects
of glass content? If so, interpret the main effects, including the appropriate test statistic
and P-value. If not, explain why not.
C.
d.
Can the effect of particle size on strength be described by interpreting the main effects
of particle size? If so, interpret the main effects, including the appropriate test statistic
and P-value. If not, explain why not.
e.
Expert Solution
This question has been solved!
Explore an expertly crafted, step-by-step solution for a thorough understanding of key concepts.

This is a popular solution!

Trending now
This is a popular solution!

Step by step
Solved in 3 steps with 11 images

Recommended textbooks for you
MATLAB: An Introduction with Applications
Statistics
ISBN:
9781119256830
Author:
Amos Gilat
Publisher:
John Wiley & Sons Inc

Probability and Statistics for Engineering and th…
Statistics
ISBN:
9781305251809
Author:
Jay L. Devore
Publisher:
Cengage Learning

Statistics for The Behavioral Sciences (MindTap C…
Statistics
ISBN:
9781305504912
Author:
Frederick J Gravetter, Larry B. Wallnau
Publisher:
Cengage Learning
MATLAB: An Introduction with Applications
Statistics
ISBN:
9781119256830
Author:
Amos Gilat
Publisher:
John Wiley & Sons Inc
Probability and Statistics for Engineering and th…
Statistics
ISBN:
9781305251809
Author:
Jay L. Devore
Publisher:
Cengage Learning
Statistics for The Behavioral Sciences (MindTap C…
Statistics
ISBN:
9781305504912
Author:
Frederick J Gravetter, Larry B. Wallnau
Publisher:
Cengage Learning

Elementary Statistics: Picturing the World (7th E…
Statistics
ISBN:
9780134683416
Author:
Ron Larson, Betsy Farber
Publisher:
PEARSON

The Basic Practice of Statistics
Statistics
ISBN:
9781319042578
Author:
David S. Moore, William I. Notz, Michael A. Fligner
Publisher:
W. H. Freeman

Introduction to the Practice of Statistics
Statistics
ISBN:
9781319013387
Author:
David S. Moore, George P. McCabe, Bruce A. Craig
Publisher:
W. H. Freeman