Alcohol Consumption Mean SE None 3.49 0.20 Moderate 4.09 0.22 a. Construct a bar graph that incorporates all of the information in the table. b. Looking at your graph, do you think that alcohol con- sumption has an effect on perceived attractiveness?
Alcohol Consumption Mean SE None 3.49 0.20 Moderate 4.09 0.22 a. Construct a bar graph that incorporates all of the information in the table. b. Looking at your graph, do you think that alcohol con- sumption has an effect on perceived attractiveness?

Glencoe Algebra 1, Student Edition, 9780079039897, 0079039898, 2018
18th Edition
ISBN:9780079039897
Author:Carter
Publisher:Carter
Chapter10: Statistics
Section10.3: Measures Of Spread
Problem 1GP

Related questions
Question
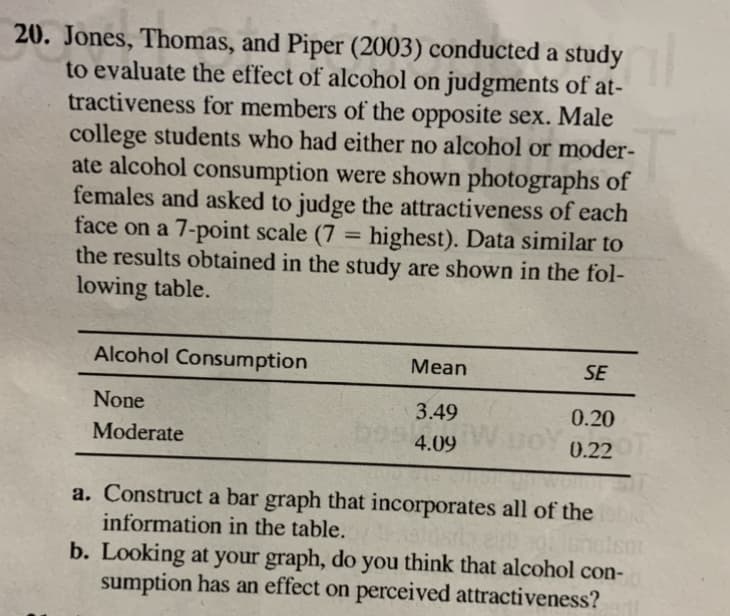
Transcribed Image Text:20. Jones, Thomas, and Piper (2003) conducted a study
to evaluate the effect of alcohol on judgments of at-
tractiveness for members of the opposite sex. Male
college students who had either no alcohol or moder-
ate alcohol consumption were shown photographs of
females and asked to judge the attractiveness of each
face on a 7-point scale (7 = highest). Data similar to
the results obtained in the study are shown in the fol-
lowing table.
%3D
Alcohol Consumption
Mean
SE
None
3.49
0.20
Moderate
4.09
0.22
a. Construct a bar graph that incorporates all of the
information in the table.
nelsm
b. Looking at your graph, do you think that alcohol con-
sumption has an effect on perceived attractiveness?
Expert Solution
This question has been solved!
Explore an expertly crafted, step-by-step solution for a thorough understanding of key concepts.

This is a popular solution!

Trending now
This is a popular solution!

Step by step
Solved in 2 steps with 1 images

Knowledge Booster


Learn more about
Need a deep-dive on the concept behind this application? Look no further. Learn more about this topic, statistics and related others by exploring similar questions and additional content below.Recommended textbooks for you
Glencoe Algebra 1, Student Edition, 9780079039897…
Algebra
ISBN:
9780079039897
Author:
Carter
Publisher:
McGraw Hill
Glencoe Algebra 1, Student Edition, 9780079039897…
Algebra
ISBN:
9780079039897
Author:
Carter
Publisher:
McGraw Hill