Tourism in the 1990s Suppose the following table gives the number of people (in thousands) who visited Australia and South Africa in 1998. То Australia South Africa North America 450 180 From Europe 960 960 Asia 1,800 190 Referring to the 1998 tourism figures, assume that the following (fictitious) figures represent the corresponding numbers from 1988. То Australia South Africa North America 490 110 From Europe 91 790 Asia 1,400 60 Take A to be the 3 x 2 matrix whose entries are the 1998 tourism figures and take B to be the 3 x 2 matrix whose entries are the 1988 tourism figures. (a) Compute the matrix A – B. What does this matrix represent? It represents changes in number of visitors in 1998. It represents changes in number of visitors in 1988. It represents changes in number of visitors over the period 1988–1998. It represents changes in number of visitors over the period 1998-2008. (b) Assuming that the changes in tourism over 1988-1998 are repeated in 1998-2008, give a formula (in terms of A and B) that predicts the number of visitors from the three regions to Australia and South Africa in 2008.
Tourism in the 1990s Suppose the following table gives the number of people (in thousands) who visited Australia and South Africa in 1998. То Australia South Africa North America 450 180 From Europe 960 960 Asia 1,800 190 Referring to the 1998 tourism figures, assume that the following (fictitious) figures represent the corresponding numbers from 1988. То Australia South Africa North America 490 110 From Europe 91 790 Asia 1,400 60 Take A to be the 3 x 2 matrix whose entries are the 1998 tourism figures and take B to be the 3 x 2 matrix whose entries are the 1988 tourism figures. (a) Compute the matrix A – B. What does this matrix represent? It represents changes in number of visitors in 1998. It represents changes in number of visitors in 1988. It represents changes in number of visitors over the period 1988–1998. It represents changes in number of visitors over the period 1998-2008. (b) Assuming that the changes in tourism over 1988-1998 are repeated in 1998-2008, give a formula (in terms of A and B) that predicts the number of visitors from the three regions to Australia and South Africa in 2008.

Algebra: Structure And Method, Book 1
(REV)00th Edition
ISBN:9780395977224
Author:Richard G. Brown, Mary P. Dolciani, Robert H. Sorgenfrey, William L. Cole
Publisher:Richard G. Brown, Mary P. Dolciani, Robert H. Sorgenfrey, William L. Cole
Chapter2: Working With Real Numbers
Section2.3: Rules For Addition
Problem 7P

Related questions
Question
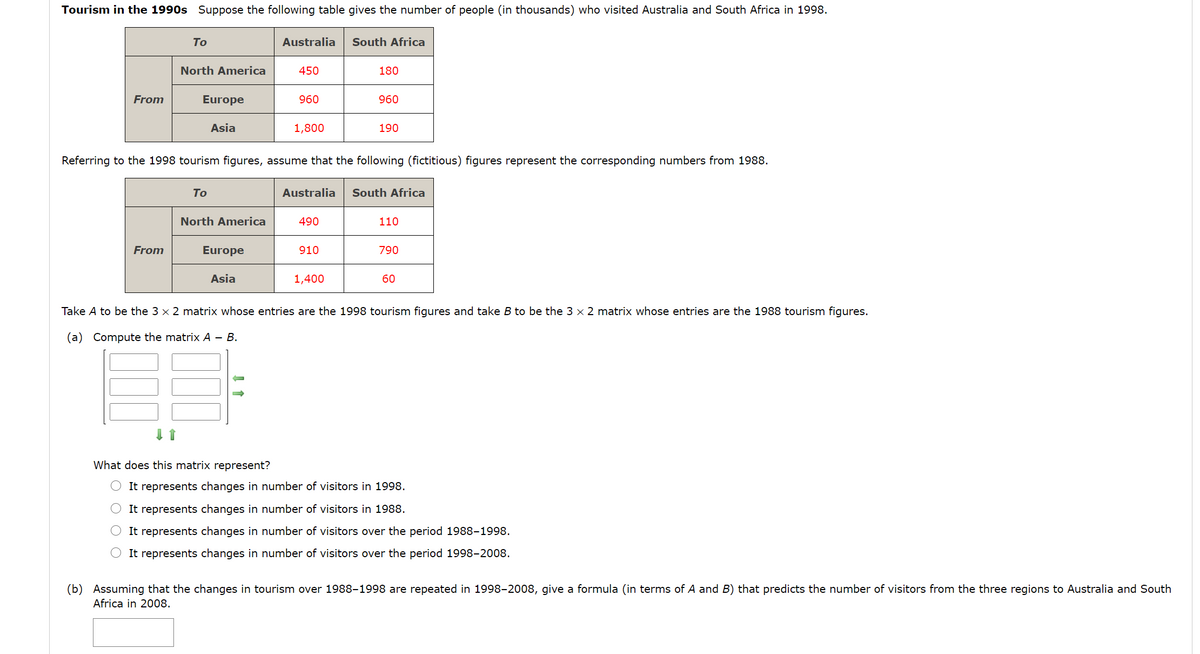
Transcribed Image Text:Tourism in the 1990s Suppose the following table gives the number of people (in thousands) who visited Australia and South Africa in 1998.
То
Australia
South Africa
North America
450
180
From
Europe
960
960
Asia
1,800
190
Referring to the 1998 tourism figures, assume that the following (fictitious) figures represent the corresponding numbers from 1988.
То
Australia
South Africa
North America
490
110
From
Europe
91
790
Asia
1,400
60
Take A to be the 3 x 2 matrix whose entries are the 1998 tourism figures and take B to be the 3 x 2 matrix whose entries are the 1988 tourism figures.
(a) Compute the matrix A – B.
What does this matrix represent?
It represents changes in number of visitors in 1998.
It represents changes in number of visitors in 1988.
It represents changes in number of visitors over the period 1988–1998.
It represents changes in number of visitors over the period 1998-2008.
(b) Assuming that the changes in tourism over 1988-1998 are repeated in 1998-2008, give a formula (in terms of A and B) that predicts the number of visitors from the three regions to Australia and South
Africa in 2008.
Expert Solution
Step 1
Let A be the 3×2 matrix whose entries are the 1998 tourism figures and B be the 3×2 matrix whose entries are the 1988 tourism figures.

Step by step
Solved in 3 steps with 1 images

Recommended textbooks for you
Algebra: Structure And Method, Book 1
Algebra
ISBN:
9780395977224
Author:
Richard G. Brown, Mary P. Dolciani, Robert H. Sorgenfrey, William L. Cole
Publisher:
McDougal Littell

Algebra & Trigonometry with Analytic Geometry
Algebra
ISBN:
9781133382119
Author:
Swokowski
Publisher:
Cengage

Algebra: Structure And Method, Book 1
Algebra
ISBN:
9780395977224
Author:
Richard G. Brown, Mary P. Dolciani, Robert H. Sorgenfrey, William L. Cole
Publisher:
McDougal Littell
Algebra & Trigonometry with Analytic Geometry
Algebra
ISBN:
9781133382119
Author:
Swokowski
Publisher:
Cengage

College Algebra (MindTap Course List)
Algebra
ISBN:
9781305652231
Author:
R. David Gustafson, Jeff Hughes
Publisher:
Cengage Learning