An agriculturist claims that she has cultivated a new variety of orange that has a significantly higher content of vitamin C than the variety that is currently the top seller. A random sample of 15 oranges of the new variety and a random sample of 15 oranges of the current top seller were sampled, giving the following results: n, = 15 , = 99.880 st = 9.0335 n2 = 15 x2 = 96.892 s = 6.4460 3.1 Let u, and 4z indicate the population mean vitamin C content of the new variety and of the current top seller, respectively. Test the agriculturist's claim using a significance level of 1%. Give both the p-value and the critical value. (10) 3.2 State the assumptions associated with the test in 3.1. (2)
An agriculturist claims that she has cultivated a new variety of orange that has a significantly higher content of vitamin C than the variety that is currently the top seller. A random sample of 15 oranges of the new variety and a random sample of 15 oranges of the current top seller were sampled, giving the following results: n, = 15 , = 99.880 st = 9.0335 n2 = 15 x2 = 96.892 s = 6.4460 3.1 Let u, and 4z indicate the population mean vitamin C content of the new variety and of the current top seller, respectively. Test the agriculturist's claim using a significance level of 1%. Give both the p-value and the critical value. (10) 3.2 State the assumptions associated with the test in 3.1. (2)

Glencoe Algebra 1, Student Edition, 9780079039897, 0079039898, 2018
18th Edition
ISBN:9780079039897
Author:Carter
Publisher:Carter
Chapter10: Statistics
Section10.1: Measures Of Center
Problem 9PPS

Related questions

Question
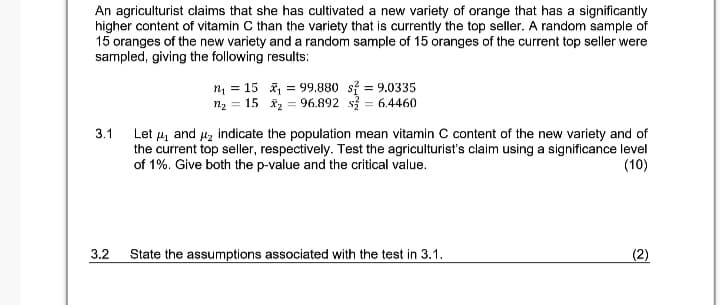
Transcribed Image Text:An agriculturist claims that she has cultivated a new variety of orange that has a significantly
higher content of vitamin C than the variety that is currently the top seller. A random sample of
15 oranges of the new variety and a random sample of 15 oranges of the current top seller were
sampled, giving the following results:
m = 15 , = 99,880 si = 9.0335
n2 = 15 x2 = 96.892 s = 6.4460
Let 4 and 4z indicate the population mean vitamin C content of the new variety and of
the current top seller, respectively. Test the agriculturist's claim using a significance level
of 1%. Give both the p-value and the critical value.
3.1
(10)
3.2
State the assumptions associated with the test in 3.1.
(2)
Expert Solution
This question has been solved!
Explore an expertly crafted, step-by-step solution for a thorough understanding of key concepts.

Step by step
Solved in 2 steps

Knowledge Booster


Learn more about
Need a deep-dive on the concept behind this application? Look no further. Learn more about this topic, statistics and related others by exploring similar questions and additional content below.Recommended textbooks for you
Glencoe Algebra 1, Student Edition, 9780079039897…
Algebra
ISBN:
9780079039897
Author:
Carter
Publisher:
McGraw Hill
Glencoe Algebra 1, Student Edition, 9780079039897…
Algebra
ISBN:
9780079039897
Author:
Carter
Publisher:
McGraw Hill