An education researcher claims that at most 3% of working college students are employed as teachers or teaching assistants. In a random sample of 400 working college students, 4% are employed as teachers or teaching assistants. At a= 0.01, is there enough evidence to reject the researcher's claim? Complete parts (a) through (e) below. (a) Identify the claim and state Ho and H, Identify the claim in this scenario. Select the correct choice below and fillin the answer box to complete your choice. (Type an integer or a decimal. Do not round) OA. % of working college students are employed as teachers or teaching assistants. OB. More than % of working college students are employed as teachers or teaching assistants. OC. The percentage of working college students who are employed as teachers or teaching assistants is not OD. At most % of working college students are employed as teachers or teaching assistants. Let p be the population proportion of successes, where a success is a working college student who is employed as a teacher or teaching assistant State H, and H, Select the correct choice below and fill in the answer boxes to complete your choice. (Round to two decimal places as needed) OA. H pe OB. H p2 | OC. Hạ: p H, pa H, p< OD. H ps OE H p> OF. He p= H, p> H, ps H, pt (b) Find the critical value(s) and identif the rejection region(s). Identify the critical value(s) for this test Zo = (Round to two decimal places as needed. Use a comma to separate answers as needed.) Identify the rejection region(s) Select the correct choice below and fill in the answer box(es) to complete your choice. (Round to two decimal places as needed.) OA. The rejection regions are z< O B. The rejection region is z< and z> OC. The rejection region is OD. The rejection region is z> (c) Find the standardized test statistic z. (Round to two decimal places as needed) (d) Decide whether to reject or fail to reject the null hypothesis and (e) interpret the decision in the context of the original claim. (1). the null hypothesis. There (2) enough evidence to (3) the researcher's claim O Reject O Fall to reject (2) O is O is not (1) (3) O support O reject
An education researcher claims that at most 3% of working college students are employed as teachers or teaching assistants. In a random sample of 400 working college students, 4% are employed as teachers or teaching assistants. At a= 0.01, is there enough evidence to reject the researcher's claim? Complete parts (a) through (e) below. (a) Identify the claim and state Ho and H, Identify the claim in this scenario. Select the correct choice below and fillin the answer box to complete your choice. (Type an integer or a decimal. Do not round) OA. % of working college students are employed as teachers or teaching assistants. OB. More than % of working college students are employed as teachers or teaching assistants. OC. The percentage of working college students who are employed as teachers or teaching assistants is not OD. At most % of working college students are employed as teachers or teaching assistants. Let p be the population proportion of successes, where a success is a working college student who is employed as a teacher or teaching assistant State H, and H, Select the correct choice below and fill in the answer boxes to complete your choice. (Round to two decimal places as needed) OA. H pe OB. H p2 | OC. Hạ: p H, pa H, p< OD. H ps OE H p> OF. He p= H, p> H, ps H, pt (b) Find the critical value(s) and identif the rejection region(s). Identify the critical value(s) for this test Zo = (Round to two decimal places as needed. Use a comma to separate answers as needed.) Identify the rejection region(s) Select the correct choice below and fill in the answer box(es) to complete your choice. (Round to two decimal places as needed.) OA. The rejection regions are z< O B. The rejection region is z< and z> OC. The rejection region is OD. The rejection region is z> (c) Find the standardized test statistic z. (Round to two decimal places as needed) (d) Decide whether to reject or fail to reject the null hypothesis and (e) interpret the decision in the context of the original claim. (1). the null hypothesis. There (2) enough evidence to (3) the researcher's claim O Reject O Fall to reject (2) O is O is not (1) (3) O support O reject

Glencoe Algebra 1, Student Edition, 9780079039897, 0079039898, 2018
18th Edition
ISBN:9780079039897
Author:Carter
Publisher:Carter
Chapter10: Statistics
Section10.6: Summarizing Categorical Data
Problem 27PPS

Related questions

Question
Transcribed Image Text:6.
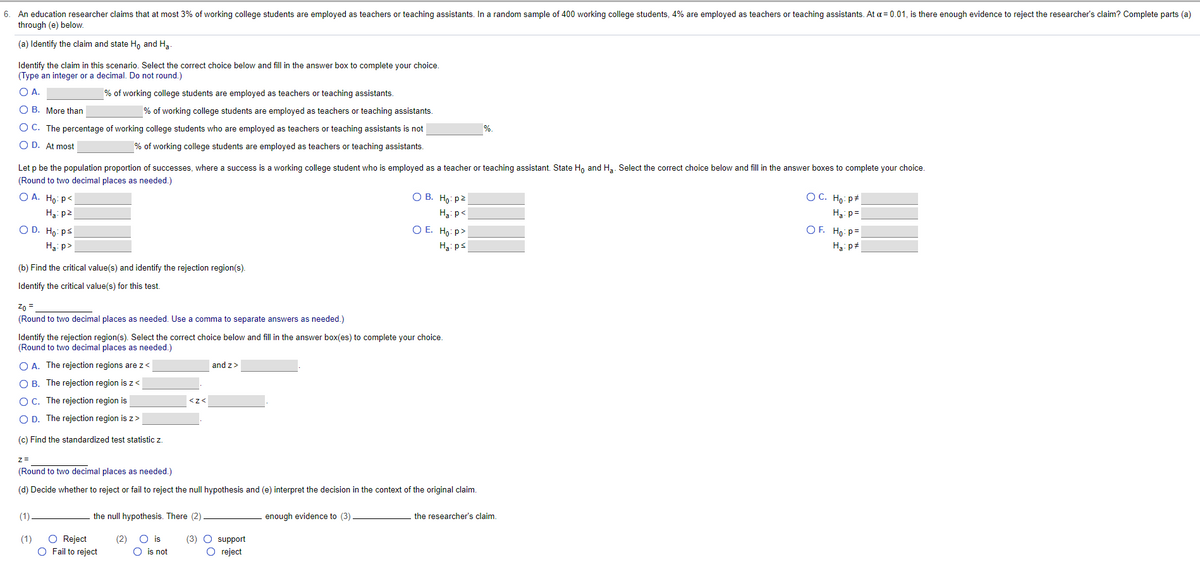
An education researcher claims that at most 3% of working college students are employed as teachers or teaching assistants. In a random sample of 400 working college students, 4% are employed as teachers or teaching assistants. At a = 0.01, is there enough evidence to reject the researcher's claim? Complete parts (a)
through (e) below.
(a) Identify the claim and state H, and H3.
Identify the claim in this scenario. Select the correct choice below and fill in the answer box to complete your choice.
(Type an integer or a decimal. Do not round.)
O A.
% of working college students are employed as teachers or teaching assistants.
O B. More than
% of working college students are employed as teachers or teaching assistants.
O C. The percentage of working college students who are employed as teachers or teaching assistants is not
%.
O D. At most
% of working college students are employed as teachers or teaching assistants.
Let p be the population proportion of successes, where a success is a working college student who is employed as a teacher or teaching assistant. State H, and H.. Select the correct choice below and fill in the answer boxes to complete your choice.
(Round to two decimal places as needed.)
O A. Ho: p<
О В. Но: р2
OC. Họ: p+
Ha: p2
Hạ:p<
Hạ: p =
O D. Ho: ps
O E. Ho: p>
OF. Ho: p=
H3: p>
H3: ps
Ha: p#
(b) Find the critical value(s) and identify the rejection region(s).
Identify the critical value(s) for this test.
Zo =
(Round to two decimal places as needed. Use a comma to separate answers as needed.)
Identify the rejection region(s). Select the correct choice below and fill in the answer box(es) to complete your choice.
(Round to two decimal places as needed.)
O A. The rejection regions are z <
and z>
O B. The rejection region is z<
O C. The rejection region is
O D. The rejection region is z >
(c) Find the standardized test statistic z.
z=
(Round to two decimal places as needed.)
(d) Decide whether to reject or fail to reject the null hypothesis and (e) interpret the decision in the context of the original claim.
(1).
the null hypothesis. There (2)
enough evidence to (3)
the researcher's claim.
O Reject
O Fail to reject
O is
O is not
(3) O support
O reject
(1)
(2)
Expert Solution
This question has been solved!
Explore an expertly crafted, step-by-step solution for a thorough understanding of key concepts.

This is a popular solution!

Trending now
This is a popular solution!

Step by step
Solved in 3 steps with 2 images

Knowledge Booster


Learn more about
Need a deep-dive on the concept behind this application? Look no further. Learn more about this topic, statistics and related others by exploring similar questions and additional content below.Recommended textbooks for you
Glencoe Algebra 1, Student Edition, 9780079039897…
Algebra
ISBN:
9780079039897
Author:
Carter
Publisher:
McGraw Hill

Algebra & Trigonometry with Analytic Geometry
Algebra
ISBN:
9781133382119
Author:
Swokowski
Publisher:
Cengage
Glencoe Algebra 1, Student Edition, 9780079039897…
Algebra
ISBN:
9780079039897
Author:
Carter
Publisher:
McGraw Hill
Algebra & Trigonometry with Analytic Geometry
Algebra
ISBN:
9781133382119
Author:
Swokowski
Publisher:
Cengage