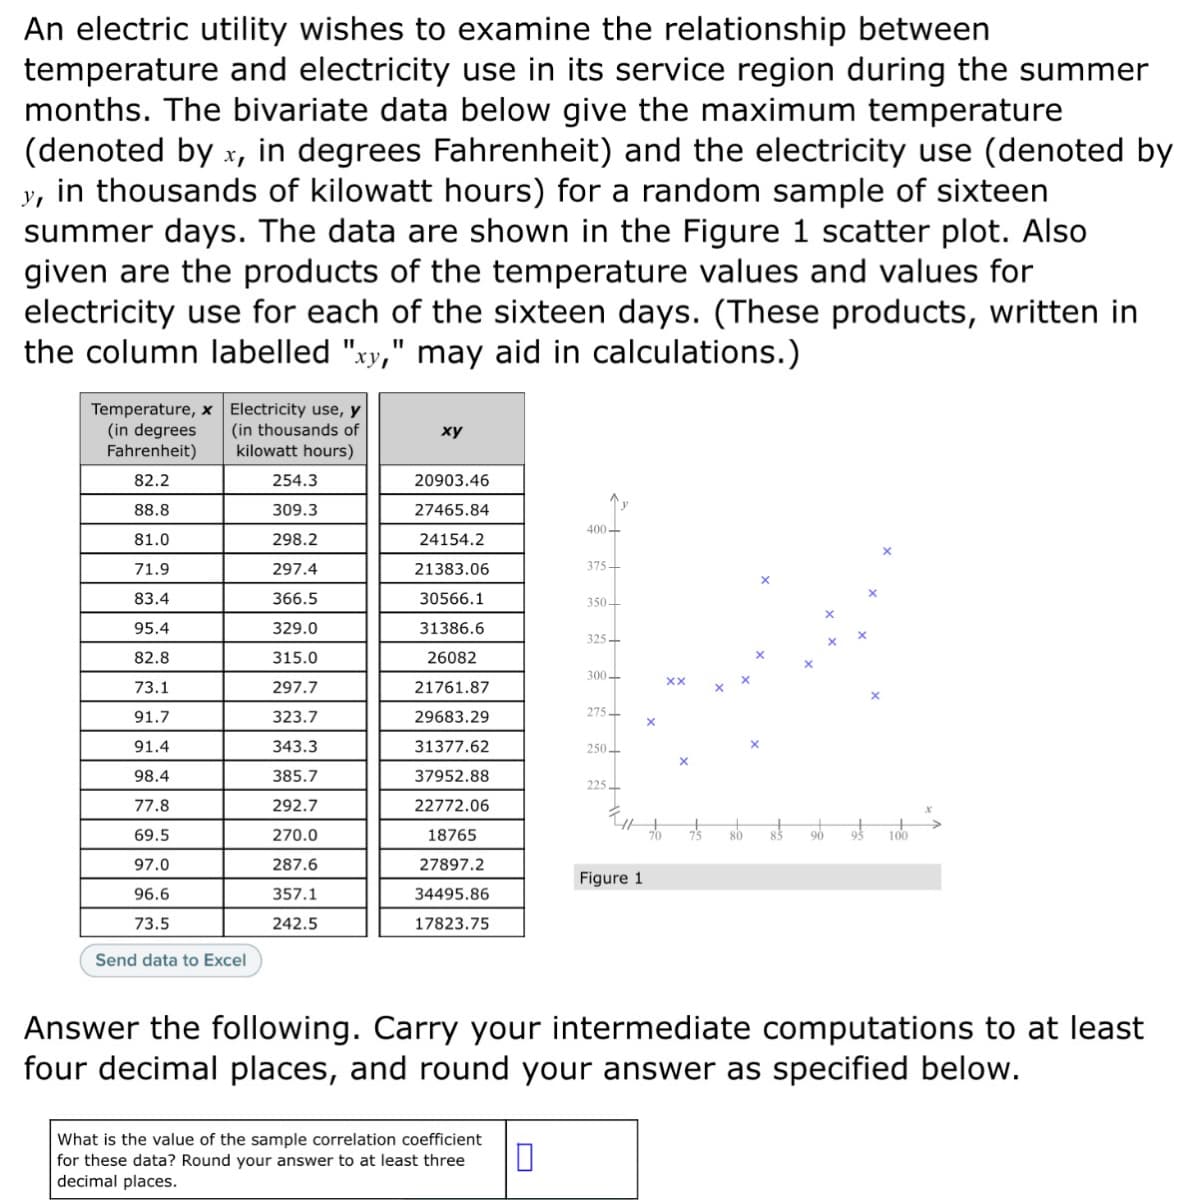
An electric utility wishes to examine the relationship between temperature and electricity use in its service region during the summer months. The bivariate data below give the maximum temperature (denoted by x, in degrees Fahrenheit) and the electricity use (denoted b y, in thousands of kilowatt hours) for a random sample of sixteen summer days. The data are shown in the Figure 1 scatter plot. Also given are the products of the temperature values and values for electricity use for each of the sixteen days. (These products, written in the column labelled "xy," may aid in calculations.) ху, Temperature, x Electricity use, y (in degrees Fahrenheit) (in thousands of kilowatt hours) ху 82.2 254.3 20903.46 88.8 309.3 27465.84 400- 81.0 298.2 24154.2 71.9 297.4 21383.06 375- 83.4 366.5 30566.1 350- 95.4 329.0 31386.6 325- 82.8 315.0 26082 300- XX 73.1 297.7 21761.87 275- 91.7 323.7 29683.29 91.4 343.3 31377.62 250 98.4 385.7 37952.88 225- 77.8 292.7 22772.06 69.5 270.0 18765 97.0 287.6 27897.2 Figure 1 96.6 357.1 34495.86 73.5 242.5 17823.75 Send data to Excel Answer the following. Carry your intermediate computations to at least four decimal places, and round your answer as specified below. What is the value of the sample correlation coefficient for these data? Round your answer to at least three decimal places.


Correlation
Correlation defines a relationship between two independent variables. It tells the degree to which variables move in relation to each other. When two sets of data are related to each other, there is a correlation between them.
Linear Correlation
A correlation is used to determine the relationships between numerical and categorical variables. In other words, it is an indicator of how things are connected to one another. The correlation analysis is the study of how variables are related.
Regression Analysis
Regression analysis is a statistical method in which it estimates the relationship between a dependent variable and one or more independent variable. In simple terms dependent variable is called as outcome variable and independent variable is called as predictors. Regression analysis is one of the methods to find the trends in data. The independent variable used in Regression analysis is named Predictor variable. It offers data of an associated dependent variable regarding a particular outcome.


Trending now
This is a popular solution!

Step by step
Solved in 2 steps


