An evaluation of a group of students was undertaken to analyze their student loan status. 1620 students were looked at. Of that groups, 899 did not require any loans to go to school. The mean scholarship amount received by this group (the group that did not require loans) was $3890. The remaining 721 students received an average scholarship amount of $4320. As a result, there was a $430 difference between the two groups which seems reasonably large. A scholarship committee suggests that this difference to state that they do a pretty good job of giving some additional scholarship assistance to students who have to take out loans. The standard deviation of this difference is given here: $340. (Note: This is the SD - not the standard error. So we do not have to divide by the square root of n.) Do a complete hypothesis test, demonstrating your understanding of each step. (You don't have to explain in extreme detail, just demonstrate your understanding of the steps involved). Use the standard value for alpha. Your answer should be done in the traditional ("older") hypothesis test format. That is, do not use the confidence interval method for this question. You will do so in a question below.
An evaluation of a group of students was undertaken to analyze their student loan status. 1620 students were looked at. Of that groups, 899 did not require any loans to go to school. The mean scholarship amount received by this group (the group that did not require loans) was $3890. The remaining 721 students received an average scholarship amount of $4320. As a result, there was a $430 difference between the two groups which seems reasonably large. A scholarship committee suggests that this difference to state that they do a pretty good job of giving some additional scholarship assistance to students who have to take out loans. The standard deviation of this difference is given here: $340. (Note: This is the SD - not the standard error. So we do not have to divide by the square root of n.) Do a complete hypothesis test, demonstrating your understanding of each step. (You don't have to explain in extreme detail, just demonstrate your understanding of the steps involved). Use the standard value for alpha. Your answer should be done in the traditional ("older") hypothesis test format. That is, do not use the confidence interval method for this question. You will do so in a question below.

A First Course in Probability (10th Edition)
10th Edition
ISBN:9780134753119
Author:Sheldon Ross
Publisher:Sheldon Ross
Chapter1: Combinatorial Analysis
Section: Chapter Questions
Problem 1.1P: a. How many different 7-place license plates are possible if the first 2 places are for letters and...

Related questions
Question
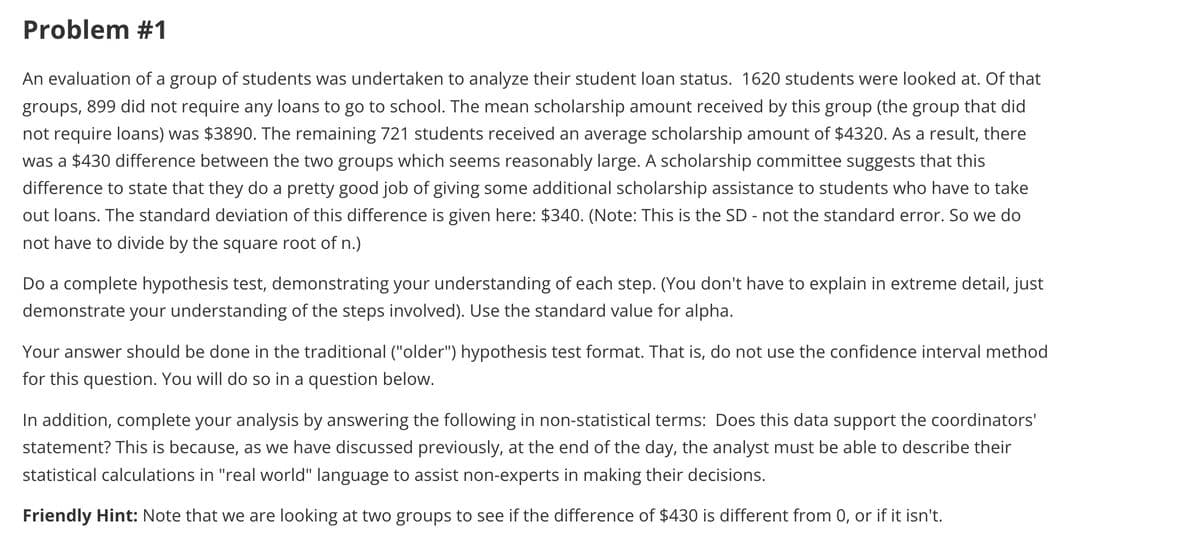
Transcribed Image Text:Problem #1
An evaluation of a group of students was undertaken to analyze their student loan status. 1620 students were looked at. Of that
groups, 899 did not require any loans to go to school. The mean scholarship amount received by this group (the group that did
not require loans) was $3890. The remaining 721 students received an average scholarship amount of $4320. As a result, there
was a $430 difference between the two groups which seems reasonably large. A scholarship committee suggests that this
difference to state that they do a pretty good job of giving some additional scholarship assistance to students who have to take
out loans. The standard deviation of this difference is given here: $340. (Note: This is the SD - not the standard error. So we do
not have to divide by the square root of n.)
Do a complete hypothesis test, demonstrating your understanding of each step. (You don't have to explain in extreme detail, just
demonstrate your understanding of the steps involved). Use the standard value for alpha.
Your answer should be done in the traditional ("older") hypothesis test format. That is, do not use the confidence interval method
for this question. You will do so in a question below.
In addition, complete your analysis by answering the following in non-statistical terms: Does this data support the coordinators'
statement? This is because, as we have discussed previously, at the end of the day, the analyst must be able to describe their
statistical calculations in "real world" language to assist non-experts in making their decisions.
Friendly Hint: Note that we are looking at two groups to see if the difference of $430 is different from 0, or if it isn't.
Expert Solution
This question has been solved!
Explore an expertly crafted, step-by-step solution for a thorough understanding of key concepts.

This is a popular solution!

Trending now
This is a popular solution!

Step by step
Solved in 2 steps

Recommended textbooks for you
A First Course in Probability (10th Edition)
Probability
ISBN:
9780134753119
Author:
Sheldon Ross
Publisher:
PEARSON

A First Course in Probability (10th Edition)
Probability
ISBN:
9780134753119
Author:
Sheldon Ross
Publisher:
PEARSON