An evaluation team set out to survey the cost of malaria drugs in two urban areas. The following data show the prices of the drugs from seven (7) randomly selected drug shops in the two urban towns in Kenya shillings. Town A 34 28 4 37 44 47 40 Town B 36 33 48 38 50 38 33 Determine the mean and the standard deviation for each town What conclusion do you make based on your results in a above? A researcher would like to know if there is a significant difference between the cost drugs in the two urban town. State the appropriate statistical test and explain why Determine a 95% and 99% confidences intervals for the mean cost of drugs in each of the two towns. State the assumptions for that appropriate statistical test Develop a null and alternative hypothesis for this test Test the hypothesis at 5% level of significance and make your conclusion What conclusion would you make at 1% level of significance


An evaluation team set out to survey the cost of malaria drugs in two urban areas. The following data show the prices of the drugs from seven (7) randomly selected drug shops in the two urban towns in Kenya shillings.
|
Town A |
34 |
28 |
4 |
37 |
44 |
47 |
40 |
|
Town B |
36 |
33 |
48 |
38 |
50 |
38 |
33 |
- Determine the mean and the standard deviation for each town
- What conclusion do you make based on your results in a above?
- A researcher would like to know if there is a significant difference between the cost drugs in the two urban town.
- State the appropriate statistical test and explain why
- Determine a 95% and 99% confidences intervals for the mean cost of drugs in each of the two towns.
- State the assumptions for that appropriate statistical test
- Develop a null and alternative hypothesis for this test
- Test the hypothesis at 5% level of significance and make your conclusion
- What conclusion would you make at 1% level of significance
Note:
Hey there! Thank you for the question. As you have posted a question with more than 3 sub-parts, as per our policy, we have solved the first 3 sub-parts for you. If you need help with the remaining parts, please re-post the question and mention the parts.
1.
The formulae for the mean and standard deviation for a variable X are as follows:
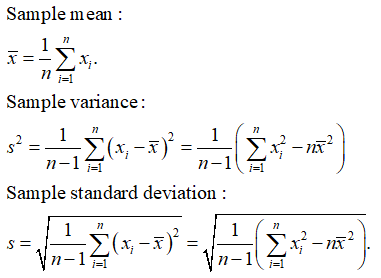
We have denoted he data on Town A as x, and that on Town B as y.
The sample size for each data set is, n = 7.
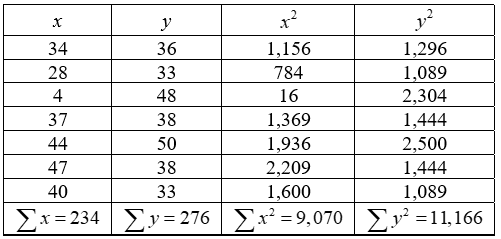
Now, use the following table for necessary calculations:
The means and standard deviations for the two datasets are obtained as follows:
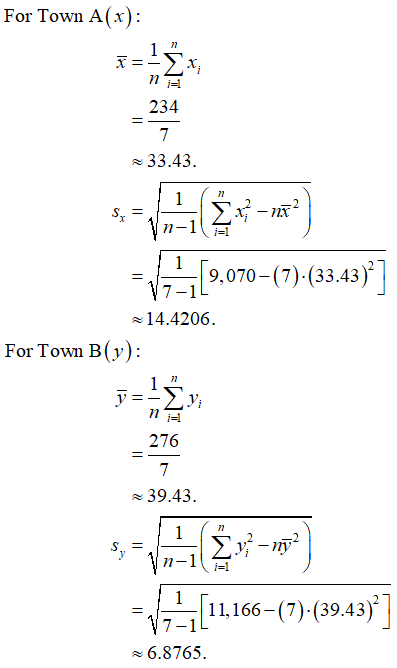
Thus, the mean for Town A is 33.43, whereas that for Town B is 39.43; the standard deviation for Town A is 14.4206, whereas that for Town B is 6.8765.

Step by step
Solved in 4 steps with 3 images


