analyze her data


Q: The value of the test statistic is
A:
Q: What is the difference between prevalence and incidence? Over time, how are the measures of…
A: The Main difference between Prevalence and Incidence is defined as follows Prevalence measures or…
Q: A researcher is analyzing data from a repeated-measures research study. If the researcher ran a…
A: The difference is, Subject 1st 2nd Difference #1 10 11 -1 #2 4 6 -2 #3 7 9 -2 #4 6 5 1…
Q: What is the coefficient of determination for the data above?
A: Step-by-step procedure to find the regression line using Excel: In Excel sheet, enter x and y in…
Q: Why is an expanded concept of "variation" necessary in statistical improvement? Is all variation…
A: Given the statement that "variation" is necessary in statistical improvement.
Q: How do we find the corresponding z-score of an area and a percentile?
A:
Q: What aspect does the repeated measure test decrease when compared to an independent t test?
A: Two samples are said to be independent if the sample values selected from one population are not…
Q: give one disadvantage of using experience sampling and one advantage of using correlational methods…
A: Disadvantage of using experience sampling Despite the strengths and promise of this method, there…
Q: If you are analyzing statistical data from a range of percentages of participant responses and…
A: If you are analyzing statistical data from a range of percentages of participant responses and…
Q: For his statistics assignment, Johnson examined differences in quality of grades obtained by…
A: Johnson examined differences in quality of grades obtained by students on the regular program of a…
Q: Does this make sense: The study found that more people were cured by the new drug than by the old…
A: In the clinical trials ,many statistical techniques are used find whether new drug is effective or…
Q: What method(observational, designed, retrospective) is mostly used in gathering a data in a high…
A:
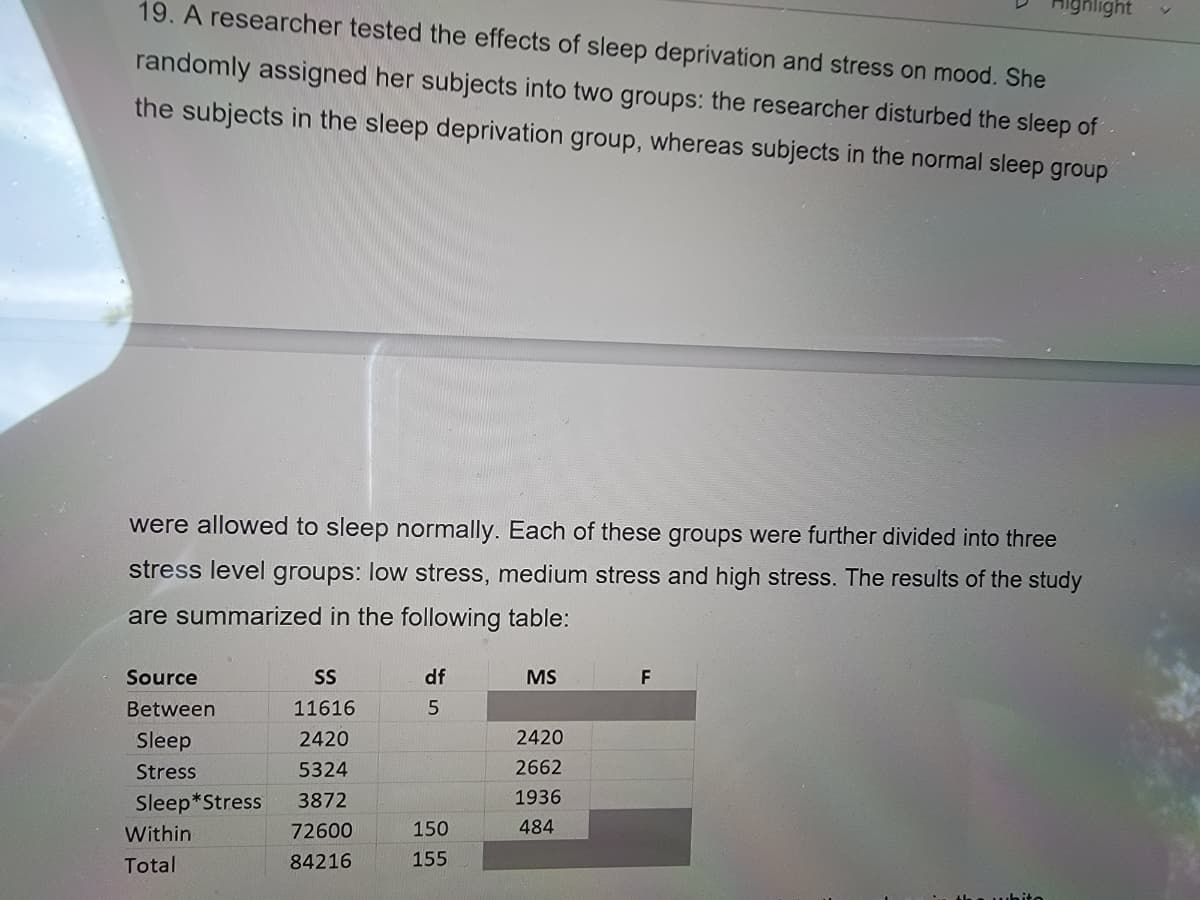
Q: What is the value of the test statistic, F?
A:
Q: What is an example of a statistical presentation ? Can you tell me what is it telling me ? What…
A: In statisics, graphs are helpful in presenting the statistical data. In order to improve the…
Q: What does the z-score of a data point tell us?
A: The z score is defined as Z = (X - mean)/SD
Q: To examine bivariate data graphically, the best choice is two side by side histograms? Define this…
A: Introduction: A histogram is a graphical display mainly used to plot a univariate continuous…
Q: Examine the output and discuss whether there is a statistically significant relationship between the…
A: Given the results of a chi- square test. We have to examine the output and discuss whether there is…
Q: Explain the tests of statistical significance?
A: It is asked to explain the tests of statistical significance.
Q: In the context of regression analysis, what is an a. outlier? b. influential observation?
A:
Q: Using the table, How would you write the results for the statistically significant improvements in…
A: Here, we have a data related to 30 individuals. Studying caregiver's stigma, a few questions have…
Q: Explain the concept of standardize the predictor variable ?
A: Standardization is the process of putting different variables on the same scale. The standardization…
Q: What are some limitations of the experience sampling methond? How do the data this method provides…
A: The limitations of experience sampling method and how its data compares with that of self-report…
Q: Consider the following scenario: you want to investigate the relationship between the number of…
A: Here we want to see if there is a relationship between 'likes' on Facebook and 'number of friends'…
Q: Please also explain why you determined whether or not the results are statistically significant. A…
A: From the given information we find the solution.
Q: Are the statistical techniques used in the analysis of data appropriate to the levels of measurement…
A: Statistics Statistics is widely used to gathering the different datasets,…
Q: Using this information, what is the coefficient of the predictor variable "Number of Brands"?
A: From the given information, the standard error for number of brands is 21.
Q: Explain why researchers typically focus on statistical independence rather than statistical…
A: Independent Events:The events A and B are said to be independent, if the result of one of the events…
Q: What is the difference between the population and sample regression functions? Is this a distinction…
A: In this question, we have to tell difference between the population regression function and simple…
Q: The test scores for a class of 155 students are computed. What is the location of the test score…
A: Given that The test scores for a class of 155 students are computed n=155 Find the location of the…
Q: A group of scientists are interested in finding out whether the days of rainfall during the spring…
A: Given: number of days of rainfall amount of maple syrup
Q: Explain Multivariate Relationships among Items?
A: Multivariate regression attempts to determine a formula that can describe how elements in a vector…
Q: If you have a Pearson correlation coefficient of .30, what is the proportion of variance accounted…
A:
Q: how would you collect data with people in this time of pandemic?
A: Plan ahead for different COVID scenarios, and draft a budget that assumes the worst. Recruit an…
Q: I want a dataset for my statistics research project. in which i can find at least 3 Quantitative…
A: It is advertise data set TV, Radio and Newspaper are independent variable and sale is dependent…
Q: What is your best estimate of the correlation coefficient shown here?
A: A scatter plot provides the idea about the form, direction, and strength of the relationship between…
Q: What is the Importance of Variability?
A:
Q: What type of data would you use for collecting data on lap swim time
A: Continuous Data represents measurements and therefore their values can’t be counted but they can be…
Q: A clinical psychologist was curious as to whether having people engage in mindfulness meditation…
A: Hello. Since your question has multiple parts, we will solve first question for you. If you want…
Q: The manner in which numerical data can be analyzed statistically depends on the level of data…
A: The manner in which numerical data can be analyzed statistically depends on the level of data…
Q: What statistical tool should I use for this problem? A graduating nursing student conducted a…
A: Test of proportion It is used to test which group have more contribution then the other. Suppose…
Q: What is the TWO SOURCES OF VARIABILITY?
A: The total variation is portioned as follows: SST=SSTR+SSE
Q: When will a chi-squared statistic equal zero? You need to very specifically discuss the data.
A: Generally, the chi-squared statistics are always related to the null hypothesis of given data. When…
Q: Does the process of statistical analysis stop at the end of the analysis?
A: Introduction:A statistical data analysis procedure can be performed broadly in the steps-…
Q: What does a z-score of 3 for a data value x represent? What does a x score of -1 for a data value x…
A: We have to interpret z scores.
Q: Why is planning what statistical tool to be used important in quantitative research?
A: Statistical tools form an important part of quantitative research in that that they provide proper…
Q: A researcher is looking at the relationship between rates of lung cancer and smoking status. they…
A: There are two variables in the study; *Smoking status of subjects, in terms of yes or no. *Lung…
Q: Your boss wants to use absenteeism rates to predict which employees will most likely quit during the…
A: Statisticians choose the appropriate test statistic with objective to know the rate of leaving the…
Q: What are the four of the most important qualitative methods?
A: Let QM denote Qualitative Methods

Step by step
Solved in 2 steps


- A company claims that its brand of dish detergent, A, is more effective than a competitor’s brand, B. Fifty dirty dishes are randomly selected and randomly divided into two groups. In one group, each dirty dish will be placed in a container of hot water with Brand A detergent and in the other group, each dirty dish will be placed in a container of hot water with Brand B detergent. The dishes will sit for two hours, and then the cleanliness of the dishes will be measured using a scale of 1–10 (1 = least clean to 10 = most clean). The difference in mean cleanliness ratings for the two detergents (A – B) will then be calculated. What is the appropriate inference procedure?As you read about each study, (a) classify the type of research that it reflects, and (b) identify the kinds of conclusions that might reasonably be drawn from the results. The director of computer technology in Emerson School District wants to gather information about the use of technology-based instruction in language arts and literature classes in the district's middle schools and high schools. For her study, the director identifies five of the top teachers in these content areas. She visits and observes each teacher's classes on three different days and subsequently interviews each teacher. Then she summarizes the ways that these teachers incorporate the use of technology into their lessons and their students' activities. The director also summarizes teachers' beliefs about the roles of technology in students' learning and motivation. (a) Classify the research as one of the following: Quantitative/descriptive Quantitative/correlational…6. In the book Business Research Methods (5th ed.), Donald R. Cooper and C. William Emory discuss studying the relationship between on-the-job accidents and smoking. Cooper and Emory describe the study as follows: Suppose a manager implementing a smoke-free workplace policy is interested in whether smoking affects worker accidents. Since the company has complete reports of on-the-job accidents, she draws a sample of names of workers who were involved in accidents during the last year. A similar sample from among workers who had no reported accidents in the last year is drawn. She interviews members of both groups to determine if they are smokers or not. The sample results are given in the following table.
- Economists, Angrist and Lavy (1999) exploited an 800 year-old rule regarding classroom size to estimate the causal effect of smaller classes on student achievement. The rule, made famous by 12th century scholar Maimonides, states that one teacher is sufficient to manage a class with up to 40 students. Classes with more than 40 students will require 2 teachers. Angrist and Lavy noticed that strict application of this rule in certain areas meant that if 80 students were enrolled in a school, then the school would divide them up into two groups of 40 students per teacher. If 81 students were enrolled, however, they would be placed in three classes of 27 students each. The rule thus generated sharp discontinuities in class sizes within schools, which, the authors argue, allow them to provide causal evidence of a boost in fifth grade math and reading scores as a result of smaller class size. a. What research design is implied by the authors’ use of Maimonides’ rule to estimate the causal…Of the 30 newly accepted juveniles into juvenile hall, half were placed in the regular program and half were placed in the vitamin and supplements program. After 12 months researchers documented the number of infractions that occurred for each of the 30 students and wanted to assess if the program worked. Group 1 (average infractions per month)• 3.2 1 0 4.7 5.3 2 1.6 4 2.8 7 4 3.1 5.7 0 1.8 Group 2 -Vitamins (average infractions per month) 0 5.2 1.2 2.1 3 1.7 0 2.9 .7 4.3 3.1 1.4 2 .9 2.6 Construct an independent samples t-test either by hand or using spss. (Be sure to interpret)