APPENDIX C-2 CUMULATIVE STANDARD NORMAL DISTRIBUTION Example: P(-1.96) = 0250 This table shows the normal area less than 00 .01 .02 03 .04 05 .06 .07 08 09 -3.7 00010 00010 00011 00010 00009 00009 00008 00008 00008 00008 00013 00012 -3.6 00016 00015 00015 00014 00014 00013 00012 00011 00022 00020 00017 -3.5 00023 00022 00021 00019 00019 00018 00017 00032 00029 -3.4 00034 00031 00030 00028 00027 00026 00025 00024 -3.3 00047 00043 00042 00039 00036 00035 00048 00045 00040 00038 00069 00052 -3.2 00066 00064 00062 00060 00058 00056 00054 00050 00097 00087 00082 00076 -3.1 00094 00090 00084 00079 00074 00071 00135 00131 -3.0 00126 00122 00118 00114 00111 00107 00104 00100 -2.9 0019 0018 0018 0017 0016 0016 0015 0015 0014 0014 -2.8 0025 0023 0026 0024 0023 0022 0021 0021 0020 0019 -2.7 0035 0034 0033 0032 0031 0030 0029 0028 0027 0026 0047 0039 -2.6 0045 0044 0043 0041 0040 0038 0037 0036 -2.5 0062 0060 0059 0057 0055 0054 0052 0051 0049 0048 -2.4 0082 0080 0078 0075 0073 0071 0069 0068 0066 0064 -2.3 0107 0104 0102 0099 0096 0094 0091 0089 0087 0084 -2.2 0139 0136 0132 0129 0125 0122 0119 0116 0113 0110 -2.1 0179 0174 0170 0166 0162 0158 0154 0150 0146 0143 -2.0 0228 0222 0217 0212 0207 0202 0197 0192 0188 0183 0250 0262 0244 -1.9 0287 0281 0274 0268 0256 0239 0233 -1.8 0359 0351 0344 0336 0329 0322 0314 0307 0301 0294 0418 -1.7 0446 0436 0427 0409 0401 0392 0384 0375 0367 -1.6 0548 0537 0526 0516 0505 0495 0485 0475 0465 0455 -1.5 0668 0655 0643 0630 0618 0606 0594 0582 0571 0559 -1.4 0808 0793 0778 0764 0749 0735 0721 0708 0694 0681 0869 -1.3 0968 0951 0934 0918 0901 0885 0853 0838 0823 -1.2 .1151 1131 .1112 .1093 1075 1056 .1038 1020 1003 0985 1335 1230 -1.1 1357 .1314 1292 1271 1251 1210 .1190 1170 -1.0 1587 1562 1539 1515 1492 1469 1446 1423 1401 1379 -0.9 1841 1814 1788 1762 1736 1711 1685 1660 1635 1611 2005 -0.8 2119 2090 2061 2033 .1977 1949 1922 1894 .1867 2358 2206 -0.7 2420 2389 2327 2296 2266 2236 2177 2148 -0.6 2743 2709 2676 2643 2611 2578 2546 2514 2483 2451 -0.5 3085 3050 .3015 2981 2946 2912 2877 2843 2810 2776 3372 3192 -0.4 3121 3446 3409 .3336 3300 .3264 3228 3156 -0.3 3821 3783 3745 3707 3669 3632 3594 3557 3520 3483 -0.2 4207 4168 4129 4090 4052 4013 3974 3936 3897 3859 -0.1 4602 4562 4522 4483 4443 4404 4364 4325 4286 4247 -0.0 5000 4960 4920 4880 4841 4801 4761 4721 4681 4641
APPENDIX C-2 CUMULATIVE STANDARD NORMAL DISTRIBUTION Example: P(-1.96) = 0250 This table shows the normal area less than 00 .01 .02 03 .04 05 .06 .07 08 09 -3.7 00010 00010 00011 00010 00009 00009 00008 00008 00008 00008 00013 00012 -3.6 00016 00015 00015 00014 00014 00013 00012 00011 00022 00020 00017 -3.5 00023 00022 00021 00019 00019 00018 00017 00032 00029 -3.4 00034 00031 00030 00028 00027 00026 00025 00024 -3.3 00047 00043 00042 00039 00036 00035 00048 00045 00040 00038 00069 00052 -3.2 00066 00064 00062 00060 00058 00056 00054 00050 00097 00087 00082 00076 -3.1 00094 00090 00084 00079 00074 00071 00135 00131 -3.0 00126 00122 00118 00114 00111 00107 00104 00100 -2.9 0019 0018 0018 0017 0016 0016 0015 0015 0014 0014 -2.8 0025 0023 0026 0024 0023 0022 0021 0021 0020 0019 -2.7 0035 0034 0033 0032 0031 0030 0029 0028 0027 0026 0047 0039 -2.6 0045 0044 0043 0041 0040 0038 0037 0036 -2.5 0062 0060 0059 0057 0055 0054 0052 0051 0049 0048 -2.4 0082 0080 0078 0075 0073 0071 0069 0068 0066 0064 -2.3 0107 0104 0102 0099 0096 0094 0091 0089 0087 0084 -2.2 0139 0136 0132 0129 0125 0122 0119 0116 0113 0110 -2.1 0179 0174 0170 0166 0162 0158 0154 0150 0146 0143 -2.0 0228 0222 0217 0212 0207 0202 0197 0192 0188 0183 0250 0262 0244 -1.9 0287 0281 0274 0268 0256 0239 0233 -1.8 0359 0351 0344 0336 0329 0322 0314 0307 0301 0294 0418 -1.7 0446 0436 0427 0409 0401 0392 0384 0375 0367 -1.6 0548 0537 0526 0516 0505 0495 0485 0475 0465 0455 -1.5 0668 0655 0643 0630 0618 0606 0594 0582 0571 0559 -1.4 0808 0793 0778 0764 0749 0735 0721 0708 0694 0681 0869 -1.3 0968 0951 0934 0918 0901 0885 0853 0838 0823 -1.2 .1151 1131 .1112 .1093 1075 1056 .1038 1020 1003 0985 1335 1230 -1.1 1357 .1314 1292 1271 1251 1210 .1190 1170 -1.0 1587 1562 1539 1515 1492 1469 1446 1423 1401 1379 -0.9 1841 1814 1788 1762 1736 1711 1685 1660 1635 1611 2005 -0.8 2119 2090 2061 2033 .1977 1949 1922 1894 .1867 2358 2206 -0.7 2420 2389 2327 2296 2266 2236 2177 2148 -0.6 2743 2709 2676 2643 2611 2578 2546 2514 2483 2451 -0.5 3085 3050 .3015 2981 2946 2912 2877 2843 2810 2776 3372 3192 -0.4 3121 3446 3409 .3336 3300 .3264 3228 3156 -0.3 3821 3783 3745 3707 3669 3632 3594 3557 3520 3483 -0.2 4207 4168 4129 4090 4052 4013 3974 3936 3897 3859 -0.1 4602 4562 4522 4483 4443 4404 4364 4325 4286 4247 -0.0 5000 4960 4920 4880 4841 4801 4761 4721 4681 4641

MATLAB: An Introduction with Applications
6th Edition
ISBN:9781119256830
Author:Amos Gilat
Publisher:Amos Gilat
Chapter1: Starting With Matlab
Section: Chapter Questions
Problem 1P

Related questions
Topic Video
Question
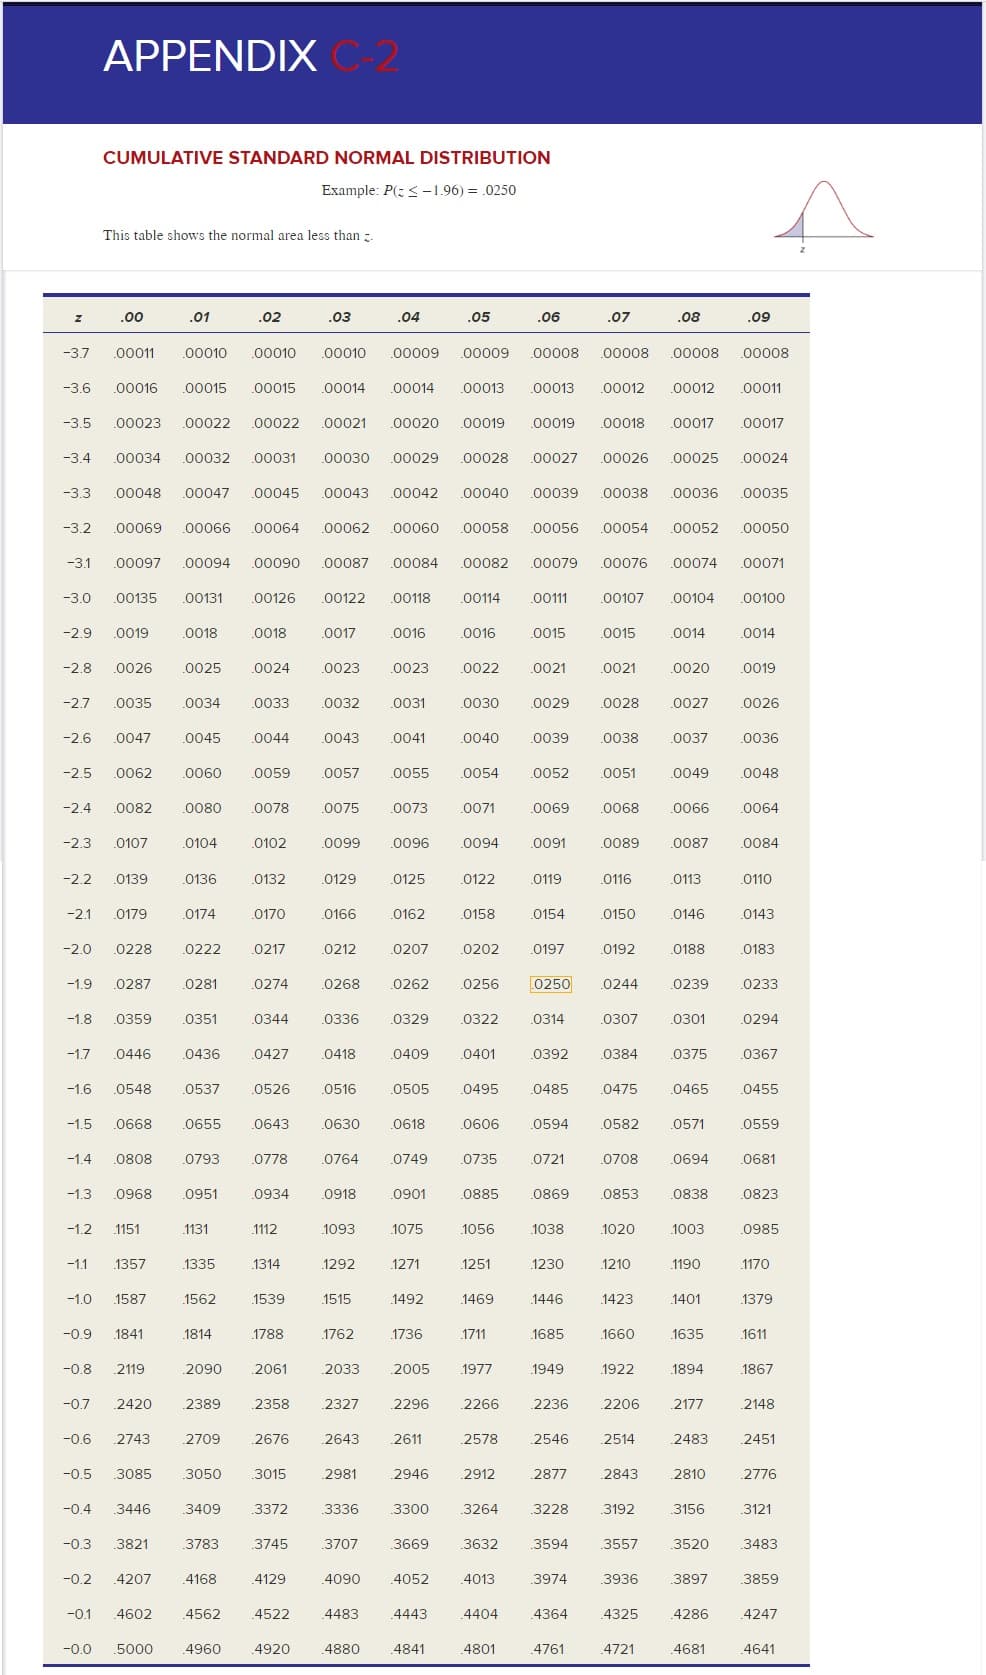
Calculate the test statistic and p-value for each sample. Use Appendix C-2 to calculate the p-value. (Negative values should be indicated by a minus sign. Round your test statistic to 3 decimal places and p-value to 4 decimal places.)
| Test Statistic | p-value | |||
| (a) H0: ππ ≤ .65 versus H1: ππ > .65, α = .05, x = 58, n = 83 | ||||
| (b) H0: ππ = .30 versus H1: ππ ≠ .30, α = .05, x = 18, n = 41 | ||||
| (c) H0: ππ ≥ .10 versus H1: ππ < .10, α = .01, x = 5, n = 101 | ||||
Transcribed Image Text:APPENDIX C-2
CUMULATIVE STANDARD NORMAL DISTRIBUTION
Example: P(-1.96) = 0250
This table shows the normal area less than
00
.01
.02
03
.04
05
.06
.07
08
09
-3.7
00010
00010
00011
00010
00009
00009
00008
00008
00008
00008
00013
00012
-3.6
00016
00015
00015
00014
00014
00013
00012
00011
00022
00020
00017
-3.5
00023
00022
00021
00019
00019
00018
00017
00032
00029
-3.4
00034
00031
00030
00028
00027
00026
00025
00024
-3.3
00047
00043
00042
00039
00036
00035
00048
00045
00040
00038
00069
00052
-3.2
00066
00064
00062
00060
00058
00056
00054
00050
00097
00087
00082
00076
-3.1
00094
00090
00084
00079
00074
00071
00135
00131
-3.0
00126
00122
00118
00114
00111
00107
00104
00100
-2.9
0019
0018
0018
0017
0016
0016
0015
0015
0014
0014
-2.8
0025
0023
0026
0024
0023
0022
0021
0021
0020
0019
-2.7
0035
0034
0033
0032
0031
0030
0029
0028
0027
0026
0047
0039
-2.6
0045
0044
0043
0041
0040
0038
0037
0036
-2.5
0062
0060
0059
0057
0055
0054
0052
0051
0049
0048
-2.4
0082
0080
0078
0075
0073
0071
0069
0068
0066
0064
-2.3
0107
0104
0102
0099
0096
0094
0091
0089
0087
0084
-2.2
0139
0136
0132
0129
0125
0122
0119
0116
0113
0110
-2.1
0179
0174
0170
0166
0162
0158
0154
0150
0146
0143
-2.0
0228
0222
0217
0212
0207
0202
0197
0192
0188
0183
0250
0262
0244
-1.9
0287
0281
0274
0268
0256
0239
0233
-1.8
0359
0351
0344
0336
0329
0322
0314
0307
0301
0294
0418
-1.7
0446
0436
0427
0409
0401
0392
0384
0375
0367
-1.6
0548
0537
0526
0516
0505
0495
0485
0475
0465
0455
-1.5
0668
0655
0643
0630
0618
0606
0594
0582
0571
0559
-1.4
0808
0793
0778
0764
0749
0735
0721
0708
0694
0681
0869
-1.3
0968
0951
0934
0918
0901
0885
0853
0838
0823
-1.2
.1151
1131
.1112
.1093
1075
1056
.1038
1020
1003
0985
1335
1230
-1.1
1357
.1314
1292
1271
1251
1210
.1190
1170
-1.0
1587
1562
1539
1515
1492
1469
1446
1423
1401
1379
-0.9
1841
1814
1788
1762
1736
1711
1685
1660
1635
1611
2005
-0.8
2119
2090
2061
2033
.1977
1949
1922
1894
.1867
2358
2206
-0.7
2420
2389
2327
2296
2266
2236
2177
2148
-0.6
2743
2709
2676
2643
2611
2578
2546
2514
2483
2451
-0.5
3085
3050
.3015
2981
2946
2912
2877
2843
2810
2776
3372
3192
-0.4
3121
3446
3409
.3336
3300
.3264
3228
3156
-0.3
3821
3783
3745
3707
3669
3632
3594
3557
3520
3483
-0.2
4207
4168
4129
4090
4052
4013
3974
3936
3897
3859
-0.1
4602
4562
4522
4483
4443
4404
4364
4325
4286
4247
-0.0
5000
4960
4920
4880
4841
4801
4761
4721
4681
4641
Expert Solution
This question has been solved!
Explore an expertly crafted, step-by-step solution for a thorough understanding of key concepts.

This is a popular solution!

Trending now
This is a popular solution!

Step by step
Solved in 7 steps with 6 images

Knowledge Booster


Learn more about
Need a deep-dive on the concept behind this application? Look no further. Learn more about this topic, statistics and related others by exploring similar questions and additional content below.Recommended textbooks for you
MATLAB: An Introduction with Applications
Statistics
ISBN:
9781119256830
Author:
Amos Gilat
Publisher:
John Wiley & Sons Inc

Probability and Statistics for Engineering and th…
Statistics
ISBN:
9781305251809
Author:
Jay L. Devore
Publisher:
Cengage Learning

Statistics for The Behavioral Sciences (MindTap C…
Statistics
ISBN:
9781305504912
Author:
Frederick J Gravetter, Larry B. Wallnau
Publisher:
Cengage Learning
MATLAB: An Introduction with Applications
Statistics
ISBN:
9781119256830
Author:
Amos Gilat
Publisher:
John Wiley & Sons Inc
Probability and Statistics for Engineering and th…
Statistics
ISBN:
9781305251809
Author:
Jay L. Devore
Publisher:
Cengage Learning
Statistics for The Behavioral Sciences (MindTap C…
Statistics
ISBN:
9781305504912
Author:
Frederick J Gravetter, Larry B. Wallnau
Publisher:
Cengage Learning

Elementary Statistics: Picturing the World (7th E…
Statistics
ISBN:
9780134683416
Author:
Ron Larson, Betsy Farber
Publisher:
PEARSON

The Basic Practice of Statistics
Statistics
ISBN:
9781319042578
Author:
David S. Moore, William I. Notz, Michael A. Fligner
Publisher:
W. H. Freeman

Introduction to the Practice of Statistics
Statistics
ISBN:
9781319013387
Author:
David S. Moore, George P. McCabe, Bruce A. Craig
Publisher:
W. H. Freeman